Figure 3.

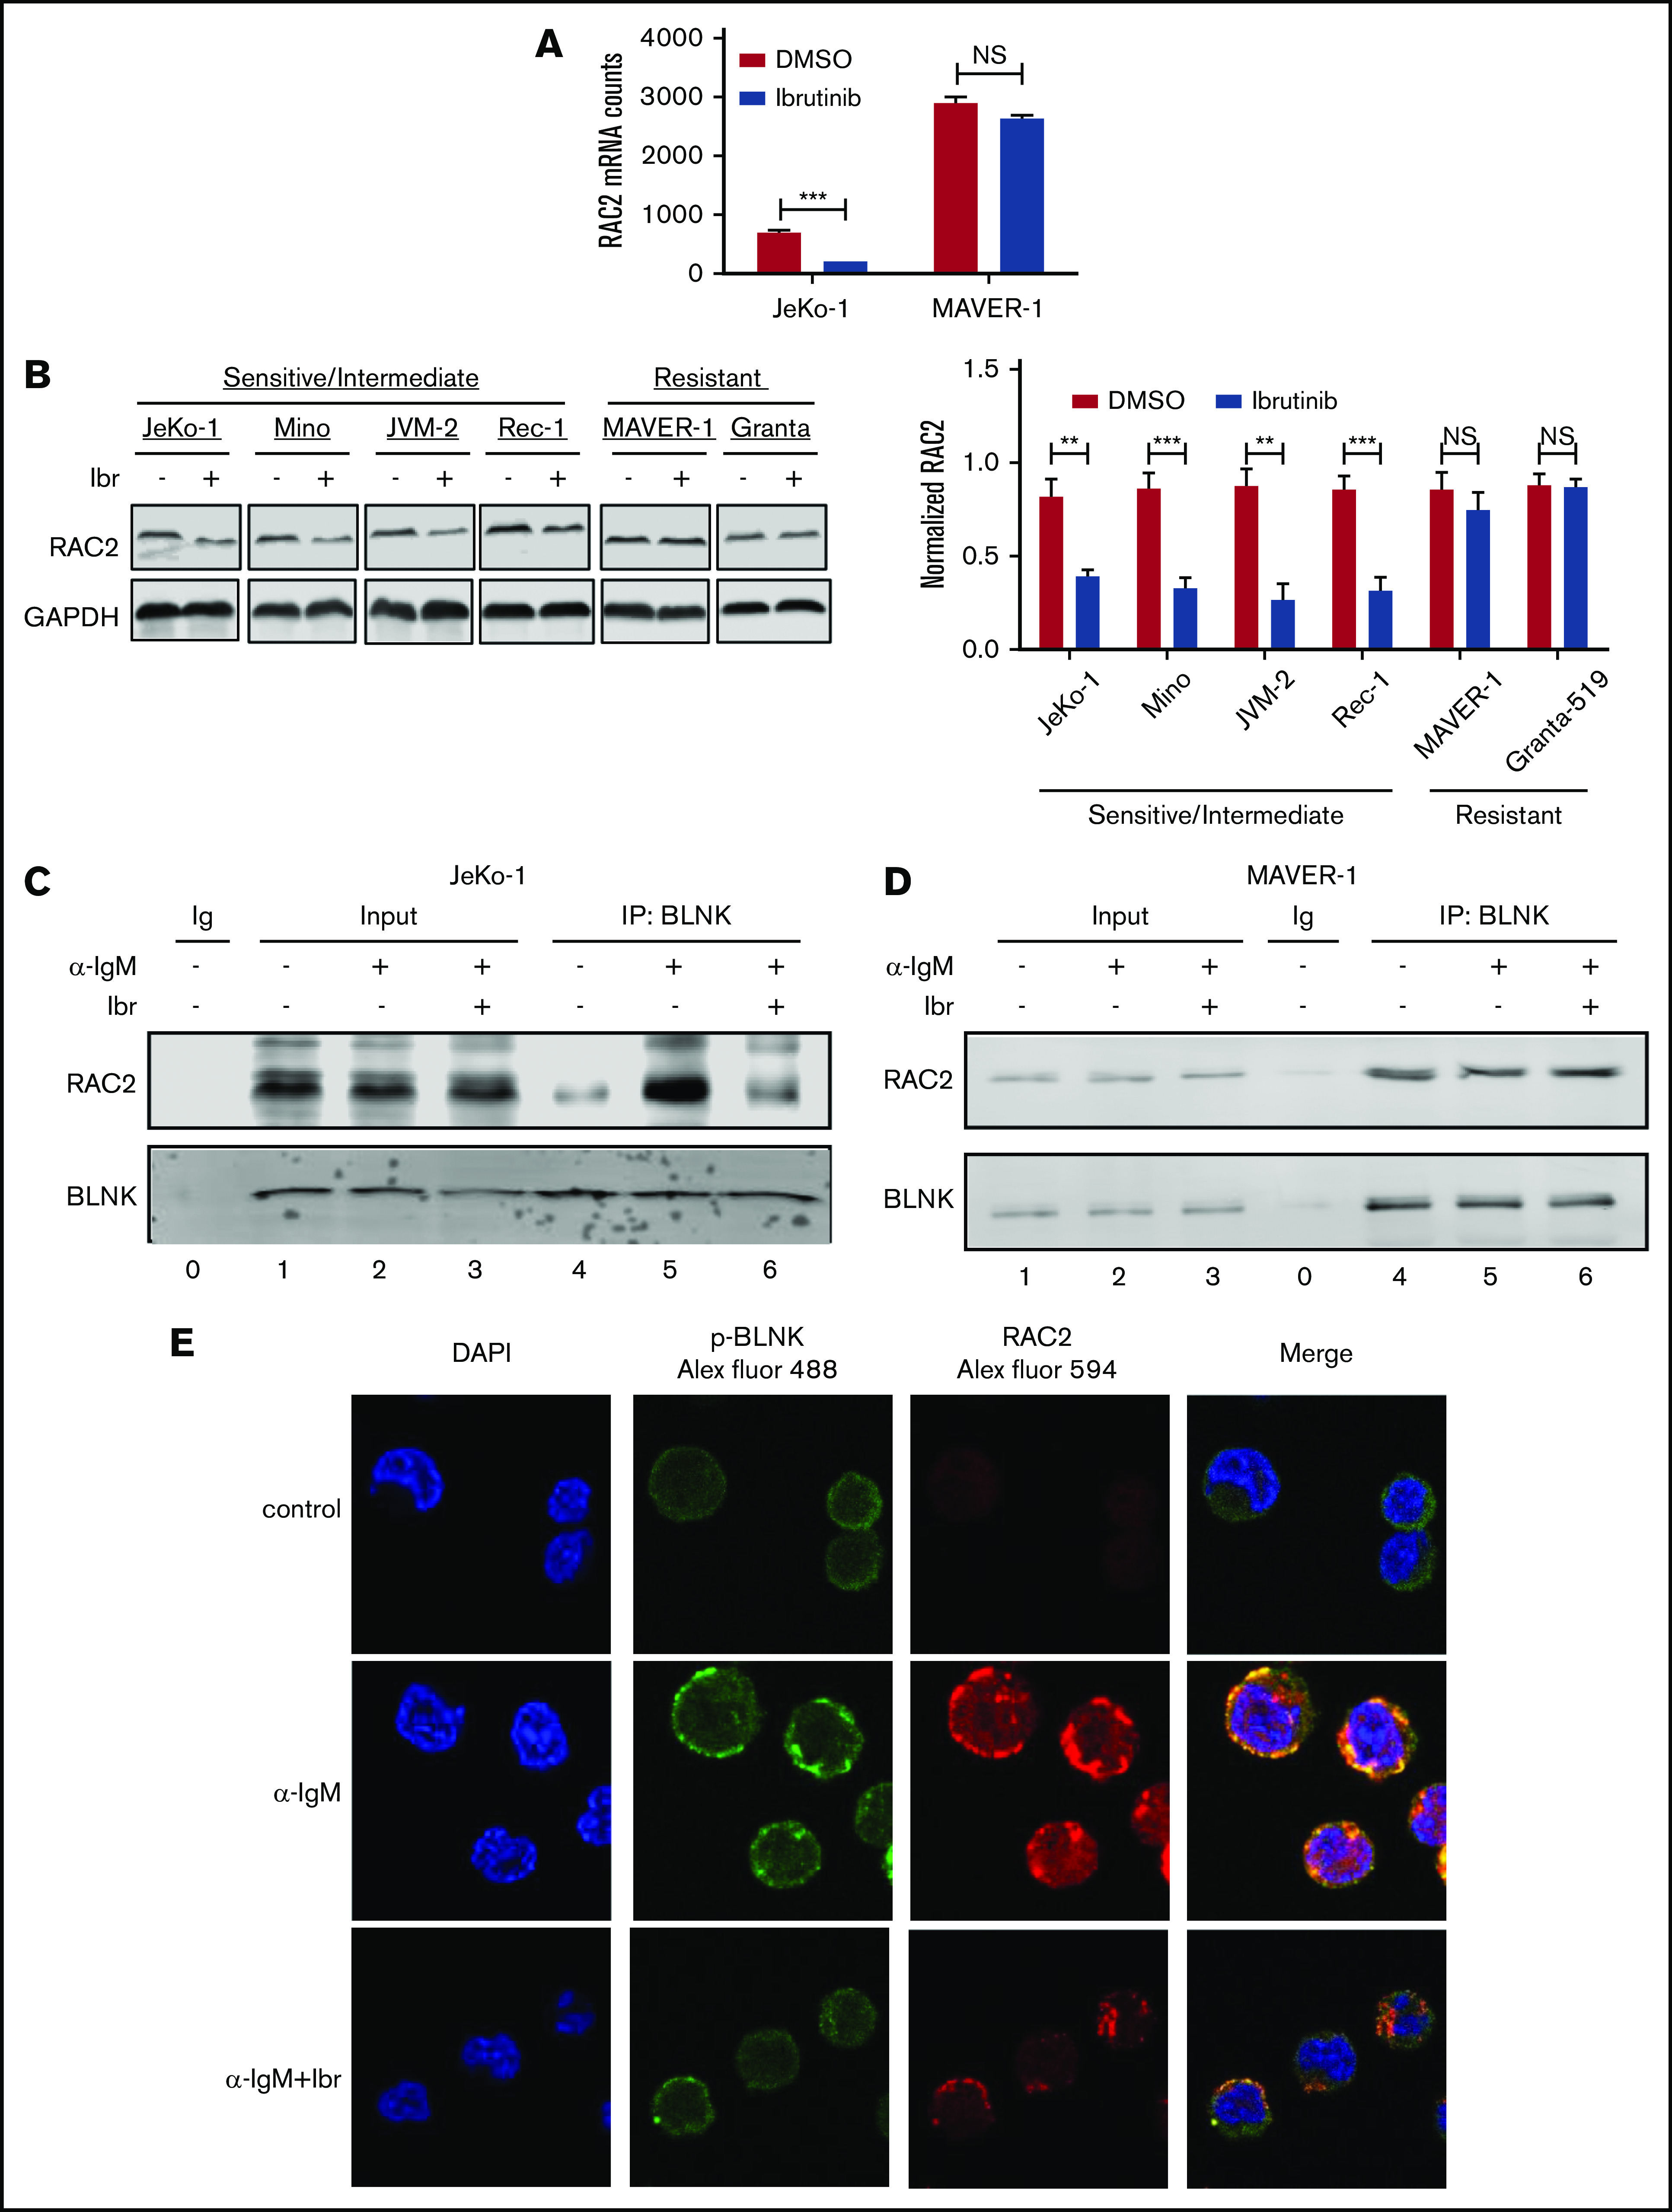
Expression and BLNK association of RAC2 are downregulated by ibrutinib in sensitive cells but not in resistant cells. (A) Expression of RAC2 mRNA in JeKo-1 vs MAVER-1, extracted from the RNA-Seq data. (B) Immunoblot of RAC2 in MCL cell lines. Cells were treated with either 400 nM of ibrutinib or DMSO for 24 hours. Gel picture in the left panel represents 1 of the 3 independent experiments that were quantified by the bar graph shown on the right. Integrated optical density of RAC2 is normalized to that of glyceraldehyde-3-phosphate dehydrogenase (GAPDH). (C-D) Immunoblotting of coimmunoprecipitation products. Cells were preincubated with or without 400 nM of ibrutinib for 1 hour and stimulated with or without anti-IgM antibody for 15 minutes before cell lysis. Immunoblotting was performed for at least 3 times using either whole-cell extracts (Input) or anti-BLNK pull-downs in JeKo-1 (C), and MAVER-1 (D). (E) Colocalization of p-BLNK and RAC2 by confocal microscopy in JeKo-1 cells. Immunofluorescent-labeled antibodies and cell treatment conditions are indicated. Cells were treated with ibrutinib for 6 hours before the αIgM stimulation. **P < .01; ***P < .001.
