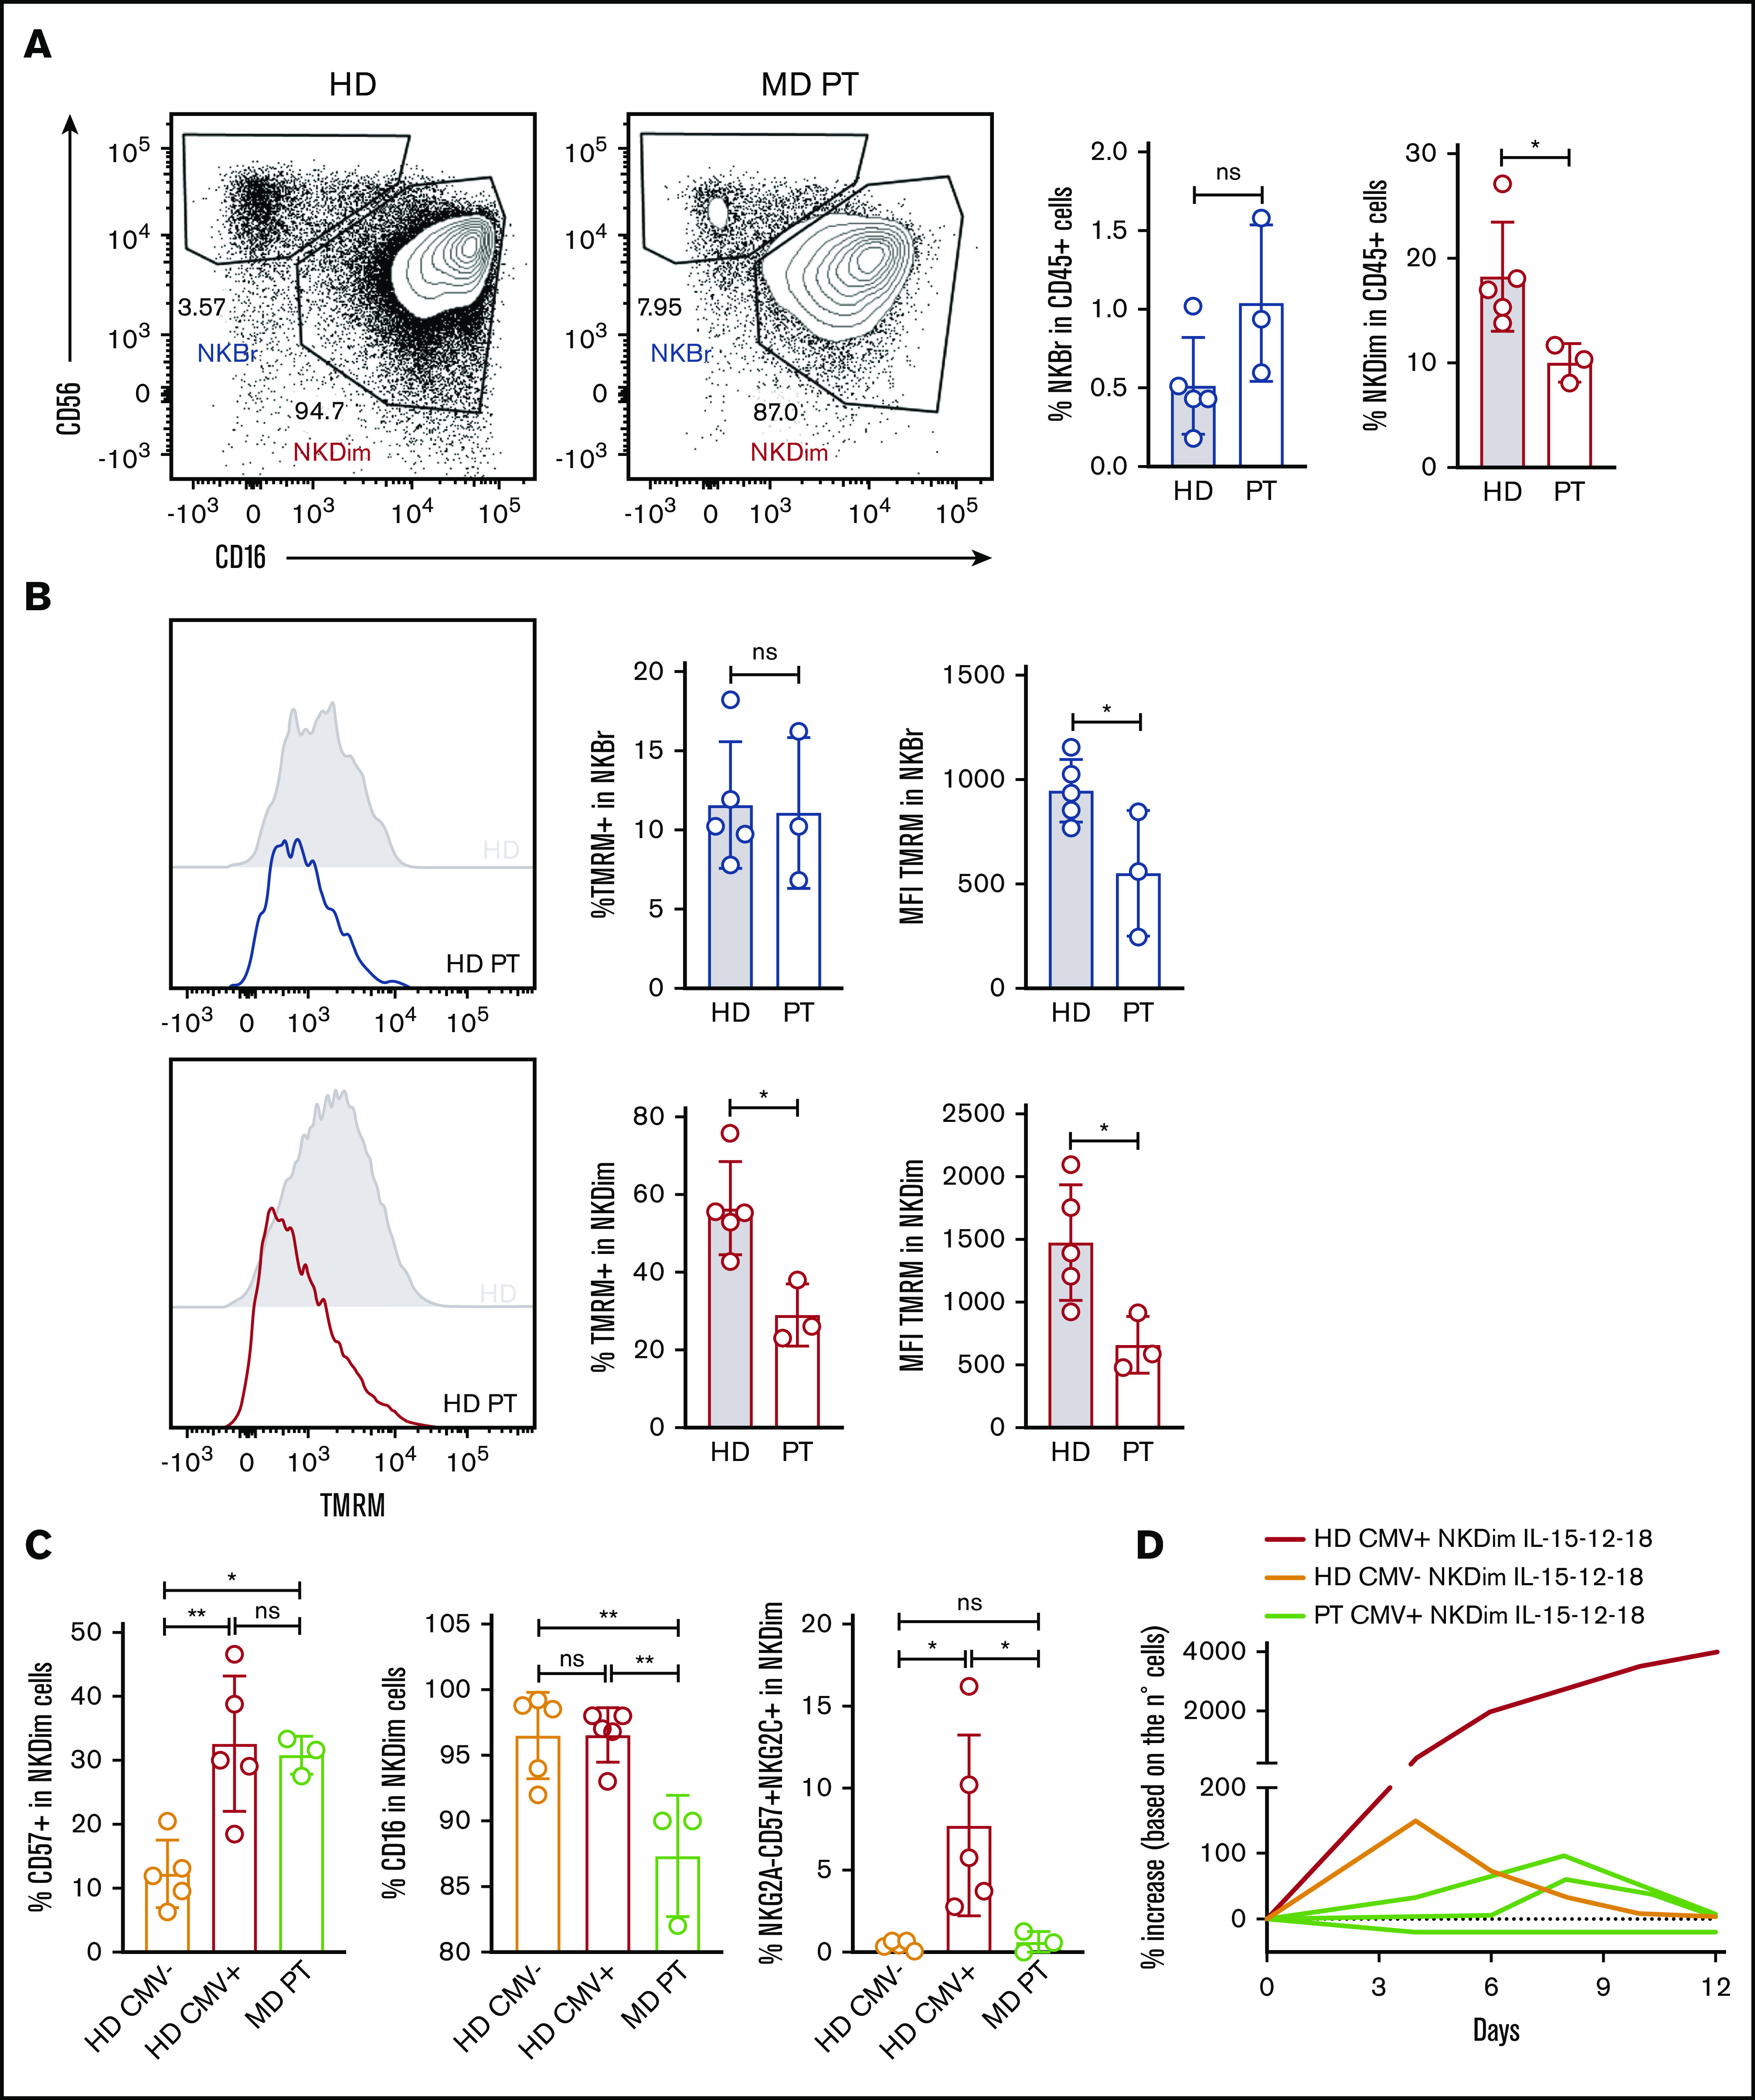
Figure 6.

NK cells from MD patients have loss of memory-like NK cells and showed reduced cellular fitness. (A) Representative plots of NKBr and NKDim cells in HDs and MD patients with OPA1 mutation. Percentage of NKBr and NKDim cells in CD45+ cells. (B) Representative histograms of mitochondrial polarization in NKDim and NKBr cells comparing HDs and MD patients. Percentage of TMRM+ cells and TMRM intensity in NKBr and NKDim cells. (C) HDs and MD patients were compared with 5 CMV+ HDs by fluorescence-activated cell sorting (FACS). FACS analysis of the percentage of CD57+, CD16+, and CD57+NKG2A−NKG2C+ cells in NKDim cells. (D) Cells from 2 HDs and 3 MD patients were cultured in IL-15/12/18 for 12 days. Percentage of increase was calculated based on the number of cells (red, CMV+ HD; orange, CMV− HD; green, MD patients; data summarized from 2 independent experiments with at least 2 HDs each and 3 MD patients). P > .05 was considered not significant (ns). *P < .05, **P < .01 using 1-way analysis of variance with Tukey’s correction.
