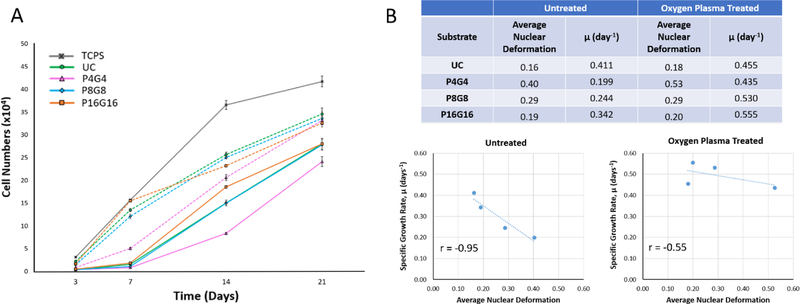
Figure 5.
Proliferation of DPSCs on PMMA substrates. (A) Cell numbers on the substrates determined by Alamar blue assay on days 3, 7, 14, and 21 (Seeding density: 104 cells.cm−2). Dashed lines represent proliferation on the oxygen plasma treated substrates. (B) Analysis of correlation between average nuclear deformations and specific growth rates (μ, day−1) on untreated and oxygen plasma treated substrates between Days 3 and 7.

