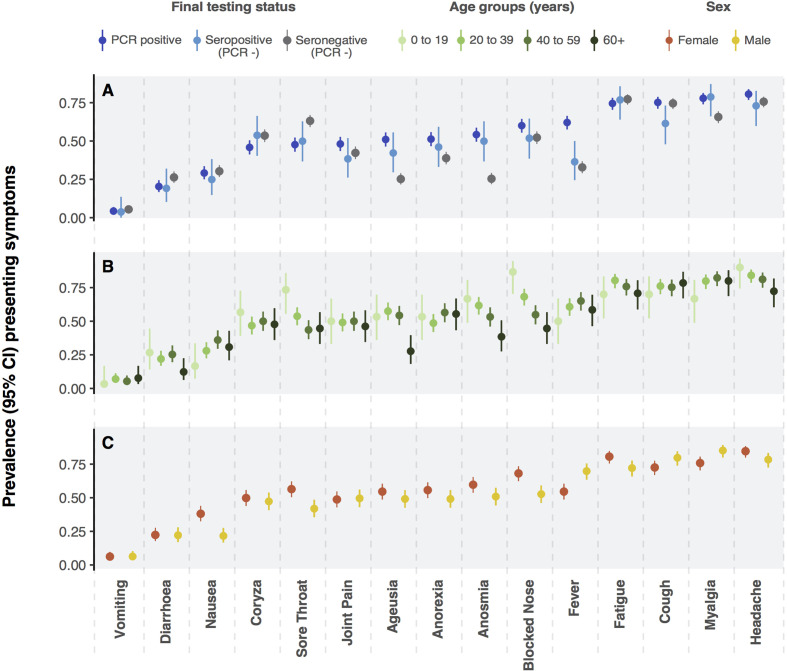
Figure 2.
Panel A presents prevalence (point) and exact binomial 95% CIs (vertical lines) of symptoms at presentation among patients with suspected COVID-19 according to reverse transcriptase (RT)-PCR result and serostatus (A). Panels B and C present the prevalence of presenting symptoms among patients with COVID-19 (RT-PCR and serology positive) stratified by age (B) and sex (C).

