
FIGURE 1.
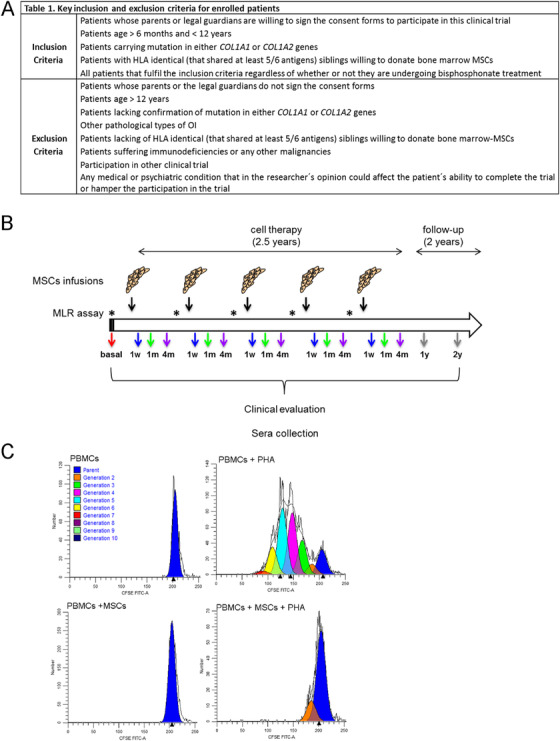
Overview of the TERCELOI clinical trial. (A) Table 1, reflecting the inclusion and exclusion criteria of the clinical trial. (B) Diagram illustrating the clinical trial workflow. The five MSCs infusions administered in total period of time of 2.5 years are indicated (black arrows). Previously to each cell infusion, mixed lymphocyte reaction assay was performed, denoted by asterisks. The visits for clinical and analytical evaluation in addition to sera collection after each cell infusion are denoted by colored arrows. Before the cell therapy: red. During the cell therapy: blue, 1 week (1 w); green, 1 month (1 m); and purple, 4 months (4 m) after each cell infusion. After the cell therapy: follow‐up visits at 1 and 2 years after the fifth cell infusion: gray. (C) Representative histogram plots of generations of divided cells as determined by ModFit‐LT software before the first MSCs infusion in P01 patient. Upper plots: controls consisted of unstimulated (left) or PHA‐stimulated PBMCs (right) isolated from P01. Dark blue peak in each plot indicates undivided parental cells. PHA‐stimulated PBMCs show several cell generations, denoting cell proliferation. Lower plots: P01 PBMCs cultured in the presence of donor MSCs, showing either no proliferation (left) or suppressed proliferation under PHA stimulation (right)