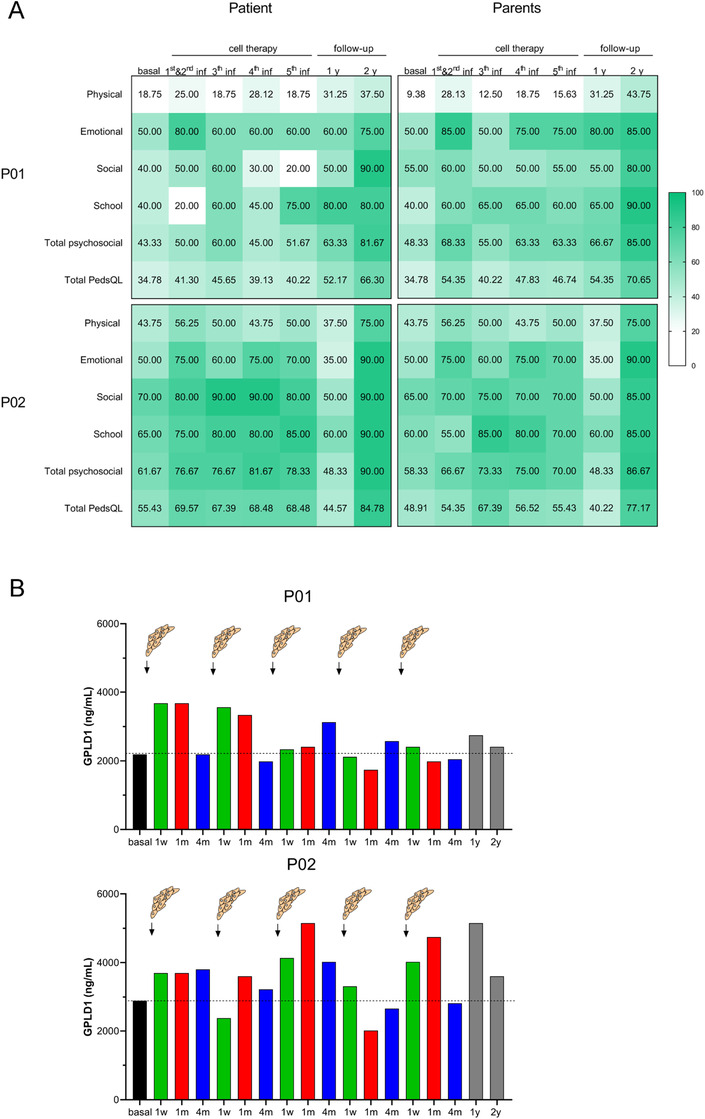
FIGURE 4.

Quality of life and GPLD1 levels of patients during TERCELOI. (A) At that indicated time points: before (basal), during (after the first, second, third, fourth, and fifth infusions), and after the MSCs therapy (1 and 2‐year follow‐up visits) questionnaires were performed to each patient and his/her parents. The obtained numerical scores ranging from 0 to 100 have been depicted with a green color scale. (B) Serum GPLD1 detection by ELISA in P01 (upper graph) and P02 (lower graph) at the mentioned time points
