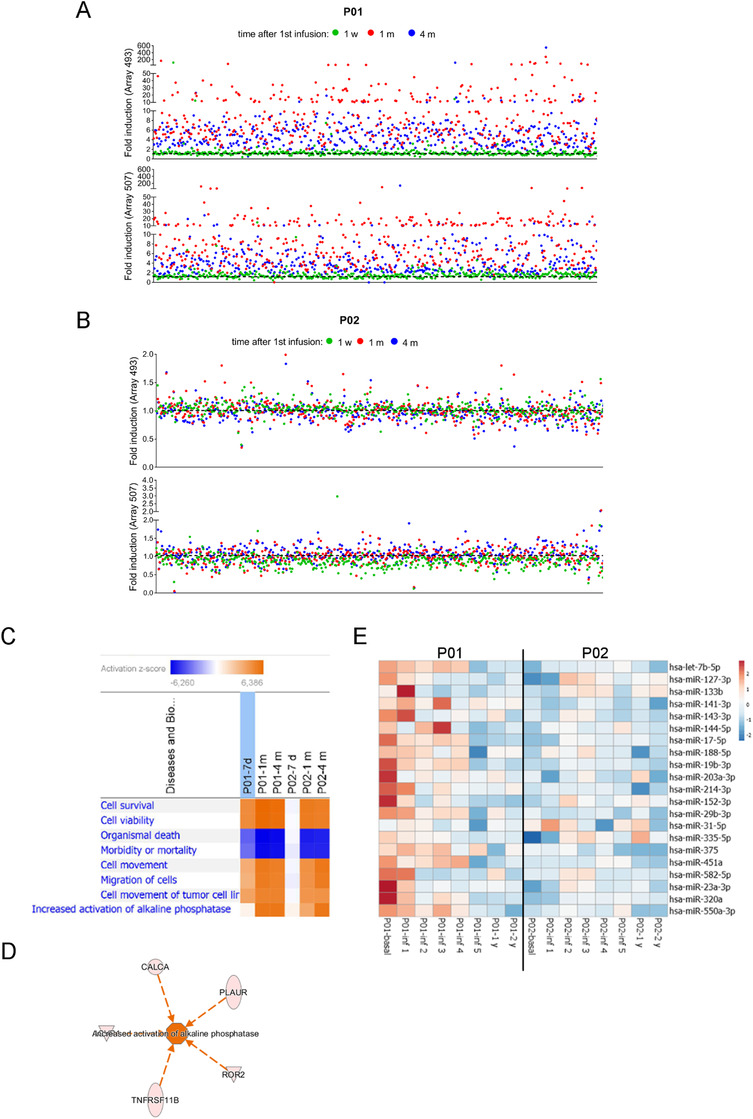
FIGURE 5.

Expression analysis of proteins and miRNAs in sera of patients. (A and B) Antibody arrays quantification of serum proteins in TERCELOI patients. The dot plots reflect the expression fold induction of the 1000 proteins included in both arrays (493 and 507) after the first MSCs infusion (1 w, green color; 1 m, red color; 4 m, blue color) when compared to the expression of those proteins before the cell therapy (black, dashed line). Each dot represents a protein. (C) IPA comparison analysis for commonly upregulated proteins (fold change > 1.3) after the first MSCs infusion (1 w, 1 m, and 4 m) in P01 and P02. The heatmap represents the significantly enriched (P < .05) biological functions predicted to be activated (z‐score > 2) or inhibited (z‐score < 2). (D) Activation network diagram for TNAP predicted by IPA based on five proteins found to be upregulated in P01 and P02 1 month after the first cell infusion. (E) Heatmap of the miRNAs expression signature of P01 and P02 serum samples, before, during (1 month after each cell infusion), and after (1 and 2 years’ follow‐up) cell therapy. Unit variance scaling was applied to the global mean normalized expression values for each miRNA. Color indicates relative upregulation (red) or downregulation (blue) for each miRNA (row)
