
FIGURE 6.
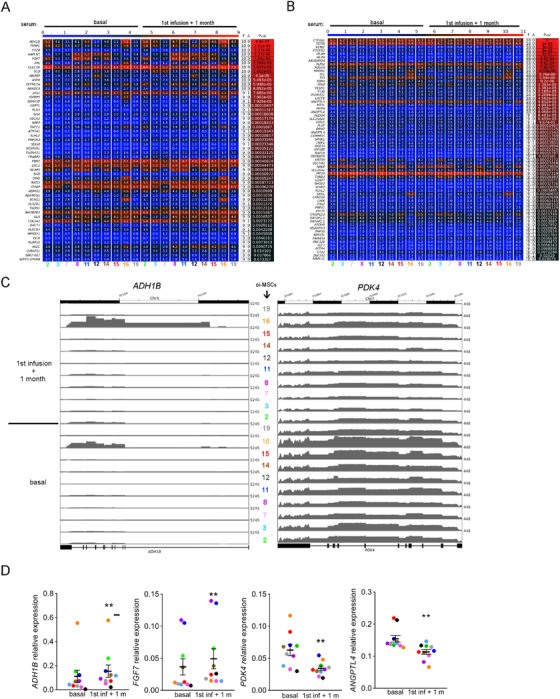
Transcriptome changes in OI MSCs in the presence of sera from P01 patient. (A and B) Heatmaps reflecting the significantly DEGs (rows) identified in the 10 OI MSCs (columns, each cell line identified by a number and a color) by RNAseq. The results were obtained comparing the data from OI MSCs cultured under osteogenic conditions (4 days) in the presence of the serum collected after the cell therapy (first infusion + 1 month) versus the serum collected before the treatment (basal). Numbers indicate the FPKM reads obtained from RNAseq for each DEG in each cell line. The columns “F” and “A” of the table denote how many votes are Favor and Against the analyzed condition, respectively. (C) Genome browser screenshot of RNAseq tracks at ADH1B and PDK4 loci in the 10 OI MSCs lines analyzed, cultured under basal or 1 month after the first cell infusion serum. (D) Quantitative PCR validation of a subset of genes in the 10 OI MSCs lines. Each color represents an OI MSCs line. **P < .01