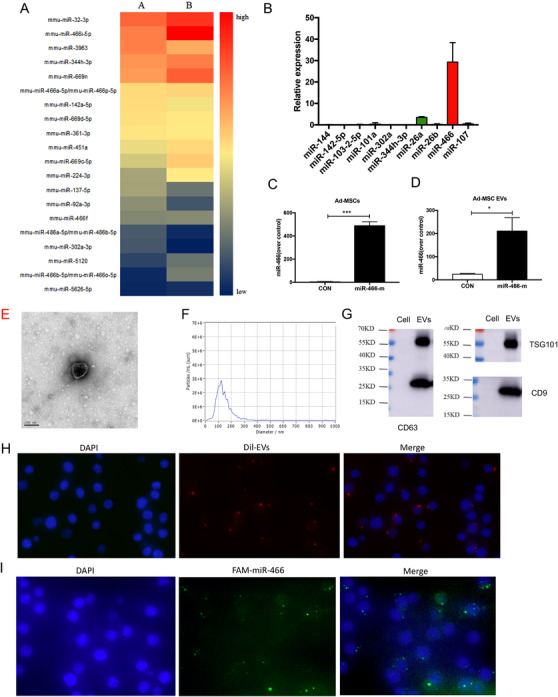
FIGURE 1.

(A) The heat‐map presents the first 20 most expressed microRNAs in Ad‐MSC EVs. (B) qRT‐PCR was used to validate the result from microRNA array. (C) Twenty‐four hours following the transfection with miR‐466 mimics, the expression of miR‐466 was significantly higher in Ad‐MSCs than those transfected with NS‐m (491.4 ± 17.5 vs. 4.2 ± 2.1, p < .001, N = 4). (D) The expression of miR‐466 in EVs derived from miR‐466 mimics transfected Ad‐MSCs was significantly higher than those derived from Ad‐MSCs transfected with NS‐m (25.9 ± 1.2 vs. 212.3 ± 32.4, p < .05, N = 4). (E) Representative electron microscopic photographs of Ad‐MSC EVs, scale bar = 200 nm. (F) Concentration and size distribution of Ad‐MSC EVs were determined by NTA. (G) Representative western blots showing the expression of exosome markers, including CD63, CD9, and Tsg101. (H) Ad‐MSC EVs were labeled with Dil (red) and then incubated with RAW 264.7 cells. DAPI (blue) was used to stain the nucleus. (I) RAW 264.7 cells were transfected with FAM‐labeled miR‐466 mimics (green) for 24 h. DAPI (blue) was used to stain the nucleus. MiR, microRNA; Ad‐MSC, mouse adipose‐derived mesenchymal stromal cells; Ad‐MSC EV, mouse adipose‐derived mesenchymal stromal cells derived extracellular vesicles; CON, control
