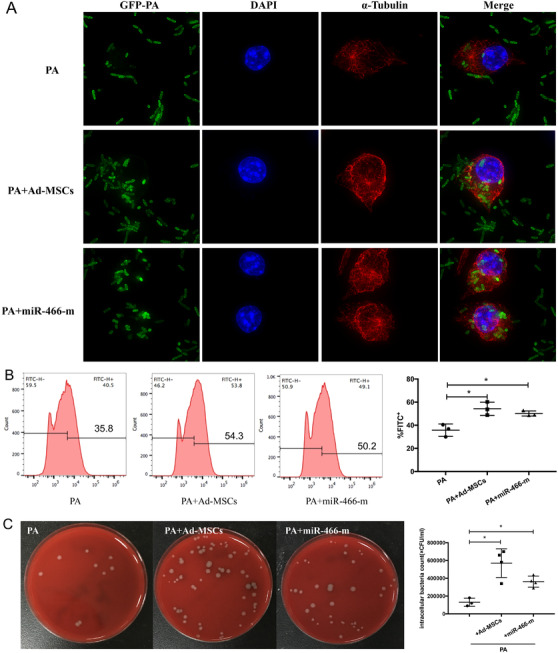
FIGURE 3.

(A) When cocultured with Ad‐MSCs, fluorescent confocal imaging showed significantly more intracellular bacteria within macrophages. Similar findings were observed when macrophages were transfected with miR‐466‐m. DAPI (blue) was used to stain the nucleus. Anti‐alpha Tubulin antibody (red) was used to stain the cytoskeleton. The green represented GFP‐PA. (B) Flow cytometry analyses suggested an increased phagocytosis when macrophages were cocultured with Ad‐MSCs or transfected with miR‐466‐m (p = .01, *p < .05, 54.3% ± 3.3 for Ad‐MSCs vs. 35.8% ± 3.1 for PA control; p = .01, *p < .05, 50.2% ± 1.3 for miR‐466‐m vs. 35.8% ± 3.1 for PA control, N = 3 for PA control, N = 3 for Ad‐MSCs, N = 3 for miR‐466‐m). (C) The CFU counting of intracellular bacteria were significantly increased in either cocultured group or miR‐466‐m transfected group (p = .006, **p < .01, 570 000 ± 80 623 for Ad‐MSCs vs. 130 000 ± 26 458 for PA, p = .003, **p < .01, 362 500 ± 30 923 for miR‐466‐m vs. 130 000 ± 26 458 for PA, N = 3 for PA control, N = 4 for Ad‐MSCs, N = 4 for miR‐466‐m). PA, Pseudomonas aeruginosa; Ad‐MSC, mouse adipose‐derived mesenchymal stromal cells; MiR‐466‐m, Ad‐MSCs transfected with miR‐466‐mimics; GFP, green fluorescent protein; DAPI, 4′,6‐diamidino‐2‐phenylindole
