. 2021 Jan 13;129(1):017002. doi: 10.1289/EHP7310

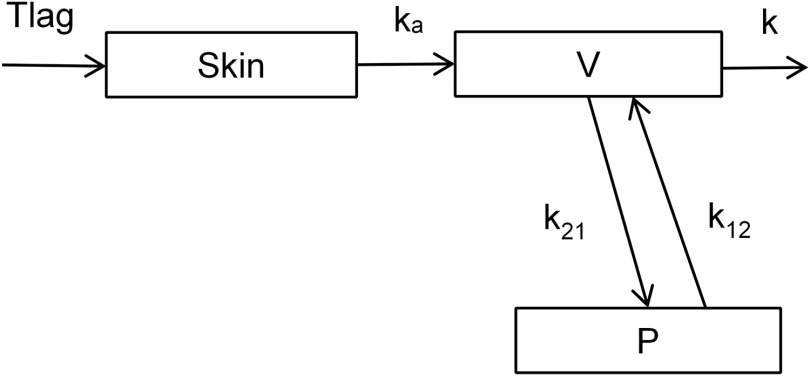
Figure 2.

Figure 2 is a flowchart comprising three steps. Step 1: A lag time leads to skin. Step 2: Skin with Absorption rate constant leads to volume of central compartment. Step 3: Volume of central compartment leads to first order elimination rate constant and with two rate constants leads to peripheral compartment. There is a two-way arrow between volume of central compartment and peripheral compartment.

Compartmental model used in the toxicokinetic analysis: lag time for skin penetration (Tlag, h), first order skin absorption constant (Ka, h-1), volume of central compartment (V, L), peripheral compartment (P) first order transfer rate constants (k12 and k21, h1), and first order elimination rate constant (k, h1).