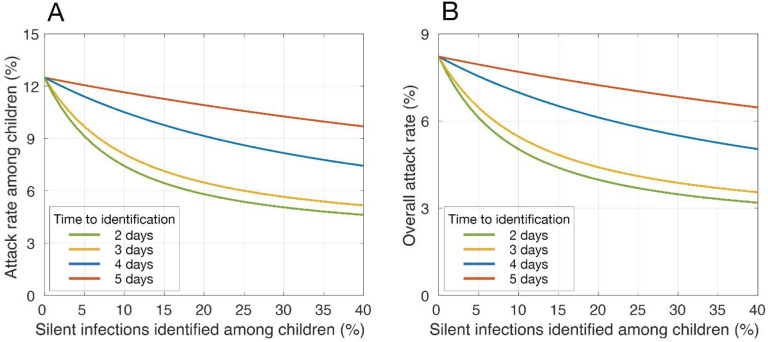
Figure 2. Estimated mean attack rates with vaccination of adults and identification of silent infections among children.
Panels (A) and (B) represent attack rates among children (under 18 years of age) and the entire population, respectively. Colour curves represent attack rates when different proportions of silent infections are identified in children, corresponding to different time delays post-infection. Vaccination coverage of adults reached 40% within 1 year.

