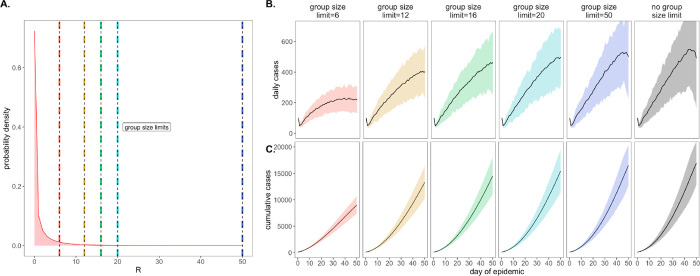
Fig. 2: Effects of group size limits on COVID-19 dynamics.
A. Negative binomial RE distribution with mean = 1.05 and dispersion parameter (k) = 0.10. The colored vertical dashes indicate group size limits that ‘chop the tail’ on the RE distribution; for 90% of the population, coincident cases allocated to the same transmission event were truncated at the corresponding threshold for each intervention. B. Daily new cases and, C. Cumulative cases, across a 50-day time series with 95% confidence intervals by standard error depicted under corresponding, color-coded group size limits.

