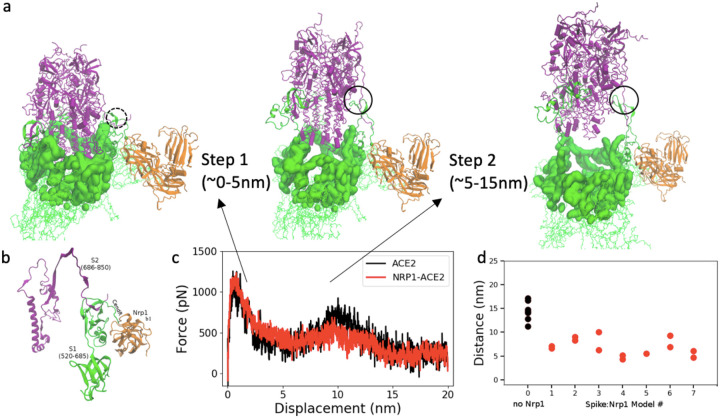
Figure 4:
(a) Two steps of S2 exit from S1 domain: S1 regions that cap S2 domain (purple) are highlighted in surface representation in green. (b) S1:S2 contacts at the cleavage site at the start of simulation (model 7 at 0 ns). (c) Pulling force versus displacement of S2 domain (with and without Nrp1). Averaged over simulations of 7 models for simulations without and with Nrp1. (d) Distance between S1 and S2 centers of mass of Chain C of the Spike protein at the time of separation (nearest distance >5Å) between the two domains (of chain C). Two repeats were done for each model except model 5, where Nrp1:S1 binding is easily disconnected during the pulling of S2 domain.

