
FIGURE 2.
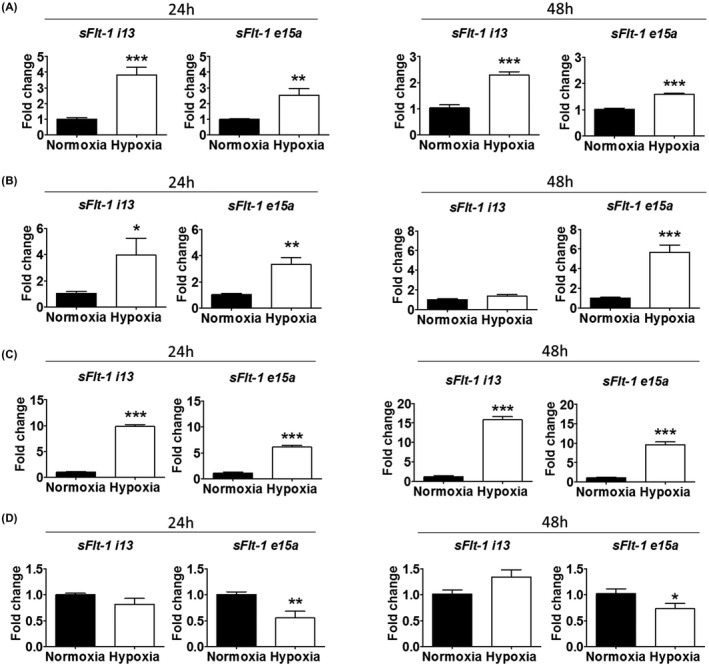
Effects of hypoxia, relative to normoxia, on sFlt‐1 i13 and e15a mRNA expression in four trophoblast cell lines. A, In BeWo, hypoxia increased sFlt‐1 i13 and e15a at both 24 and 48 hr. B, In Jar, hypoxia increased both sFlt‐1 i13 and e15a at 24 hr, and sFlt‐1 e15a at 48 hr. C, In Jeg‐3, hypoxia increased sFlt‐1 i13 and e15a at both 24 and 48 hr. D, In HTR‐8/SVneo, hypoxia did not significantly affect sFlt‐1 i13 expression, but decreased sFlt‐1 e15a expression at 24 and 48 hr. Data are presented as means ± SEM, n = 6. *p < 0.05, **p < 0.01 and ***p < 0.001.