
Fig. 2.
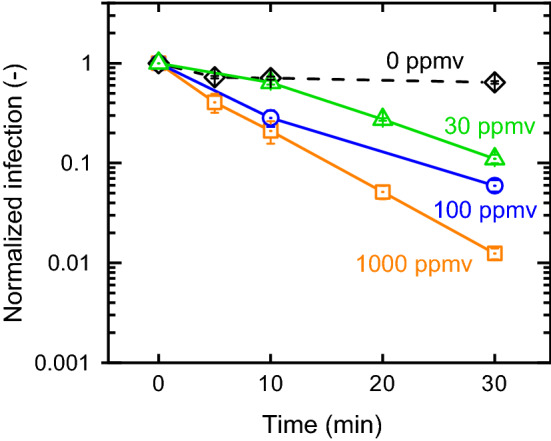
Infection of the SARS-CoV-2-Spike pseudoviruses following exposure to three ozone concentrations in different time intervals. All data were normalized to viral infection of freshly reconstituted drop. Relative humidity and temperature were 62% and 26 °C. Each data point represents the average and standard error of three repetitions