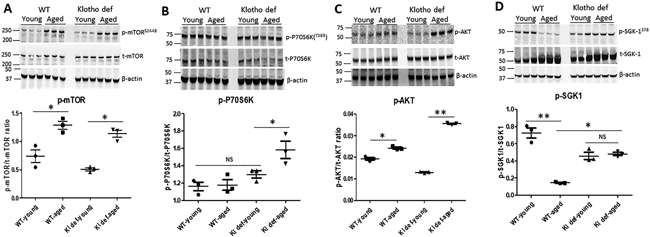
Figure 4. The SGK1 survival signaling was repressed in the aging kidney.

(A) Expression of phosphorylated mTOR and total mTOR in mouse kidneys and ratio of p-mTOR to t-mTOR. (B) Expression of phosphorylated P70S6K and total P70S6K in mouse kidneys and ratio of p-P70S6k to t-P70S6K. (C) Expression of phosphorylated AKT and total AKT in mouse kidneys amd ratio of p-AKT to t-AKT. (D) Expression of phosphorylated p-SGK1 and total SGK1 in each group of mouse kidney, and ratio of p-SGK1 to t-SGK1. N=4. Data are expressed as the mean ± S.D. * p < 0.05, or ** p<0.01 by unpaired t-test and multiple groups by one-way analysis of variance.
