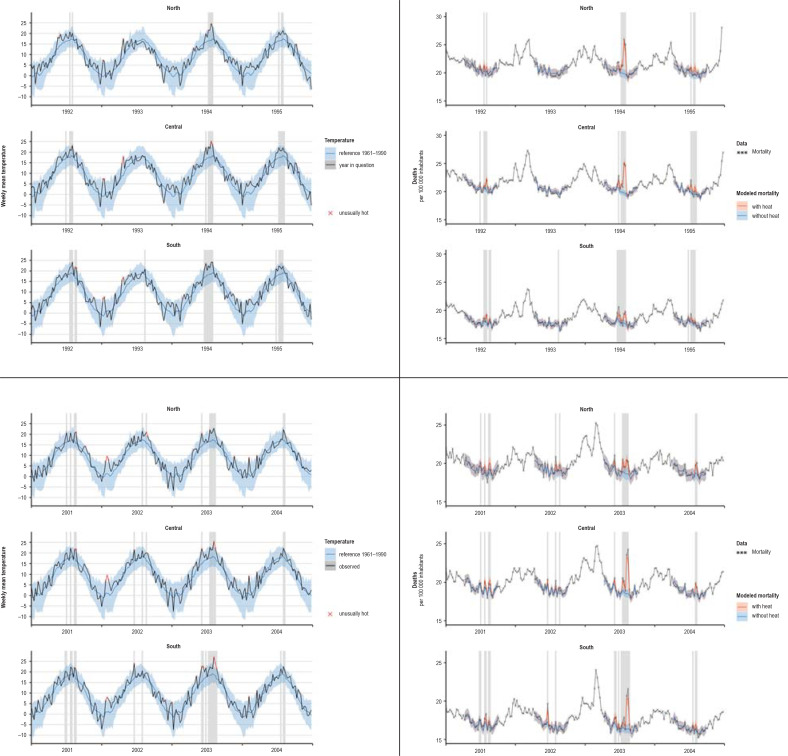
eFigure 5.
Mean temperature and modeled mortality in the northern, central, and southern regions for the heatwaves in 1994 and 2003 with adjacent years. For reference the corresponding temperature for the years 1961 to 1990 is given with 95% prediction interval. Shading shows weeks with a mean temperature of more than 20 °C. Weeks with weekly mean temperature beyond the 95% prediction interval are marked as unusually hot.
Response to heat in the southern region between 1992 and 2000
To enhance comprehension of the less pronounced response to heat in the southern region between 1992 and 2000, we look again especially at the heatwaves in 1994 and 2003. Comparing the mean temperatures in the three regions of Germany with the reference temperature (the mean for the years 1961 to 1990), it is striking that the temperatures during the 1994 heatwave in the south were still at the upper limit of the prediction interval, while in the central and northern regions they were clearly above the prediction interval. In all three regions the first peak in the temperature curve came in the last week of June. This peak is reflected in the mortality curve, before the maximum temperature in the last week of July. However, while in the south the main peak was only slight (24.2 °C, previously 23.5 °C, difference 0.7 °C), the temperatures in the central and northern regions rose much more (central: 25.1 °C versus 22.3 °C, difference 2.8 °C; north: 24.7 °C versus 19.9 °C, difference 4.8 °C).
In 2003, in contrast, the limit of the prediction interval was exceeded in central and southern Germany, while in the north the summer stayed within the normal range.

