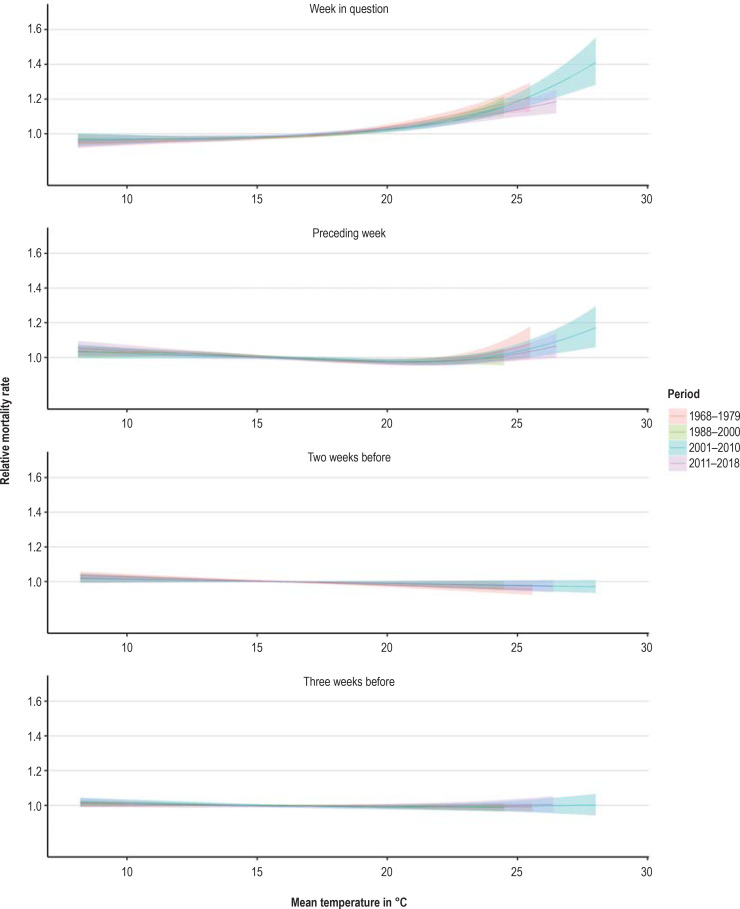
eFigure 1a.
Course of relative mortality rate (exposure–response curves) in Baden–Württemberg depending on mean temperature in current and foregoing weeks by region in the age group ≥ 85 years. Data: Deaths between the 15th and 40th calendar weeks of the years 1968 to 1979 and 1988 to 2017
Analysis of an extended time series of mortality for Baden–Württemberg
The Statistical Office of Baden-Württemberg has recorded the exact day of decease for all deaths in Baden–Württemberg since 1968. However, analysis of this time series revealed the presence of artifacts for the period 1980 to 1987, so the data from these years had to be removed. Extension of our model to the northern, central, and southern regions of Germany for this longer time series confirms the special role of the years 2001 to 2010, with the heatwave of 2003 constituting a high point for Baden–Württemberg. The foregoing periods show a similar exposure–response curve but without such high mean weekly temperatures. The exposure–response curve is somewhat lower for the period 2011 to 2018—as in the southern region as a whole.

