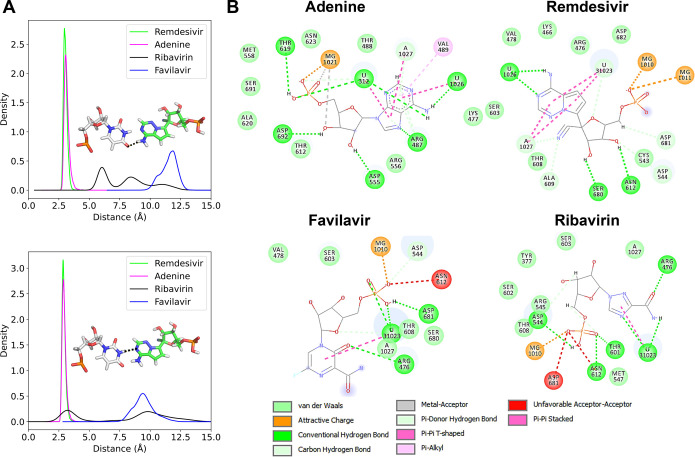
Figure 2.
Hydrogen bonds that the different drugs in their monophosphate form and the natural nucleotide adenine do with their environment. (A) Distribution of the base-pair hydrogen bond distances between the drug (remdesivir as an example is shown in the inset) and the base-pair uracil on the complementary strand. The upper and lower panels show the distributions of the different hydrogen bonds as shown in the inset. (B) All of the interactions that the drugs (shown as chemical structure) make with their environment, including hydrogen bonds to their closest nucleotides. The colors of the interactions correspond to the color shown in the legend. The interaction maps were prepared with BIOVIA Discovery Studio Visualizer.29

