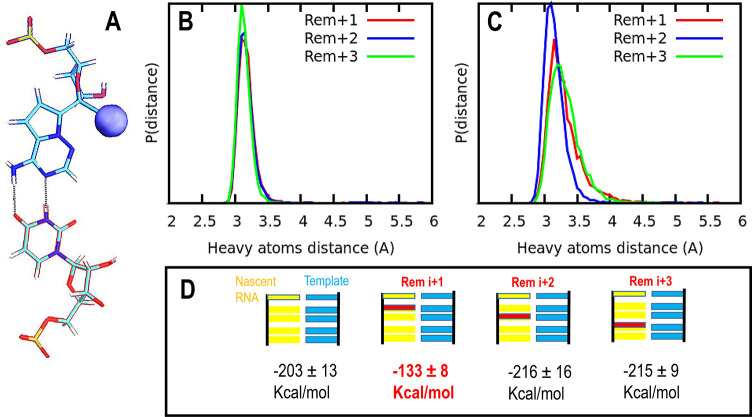
Figure 3.
(A) Schematic representation of base-pair hydrogen bonding interactions between remdesivir and the uracil complementary base. The cyano group in remdesivir is highlighted as a sphere with its van der Waals radius (blue). Probability distribution for the distances between heavy atoms forming hydrogen bonds between the nucleotides under study: (B) hydrogen bond 1, between the carbonyl group of uracil base and the amino group of remdesivir; and (C) hydrogen bond 2, among uracil amino group and remdesivir. In both figures, green, blue, and red show results for remdesivir located at i+1, i+2, and i+3, respectively. (D) Top panel: schematic representation of the RNA template in cyan and the nascent RNA strand in yellow; the position of remdesivir is highlighted in red in all cases (i+1, i+2, and i+3 locations). Lower panel: LIE (linear interaction energy, expressed in kcal/mol) between adenine located at the catalytic site (position i and surroundings: electrostatic and VdW interactions were estimated for all atom pairs). In both cases, a cutoff of 12.0 Å was applied.

