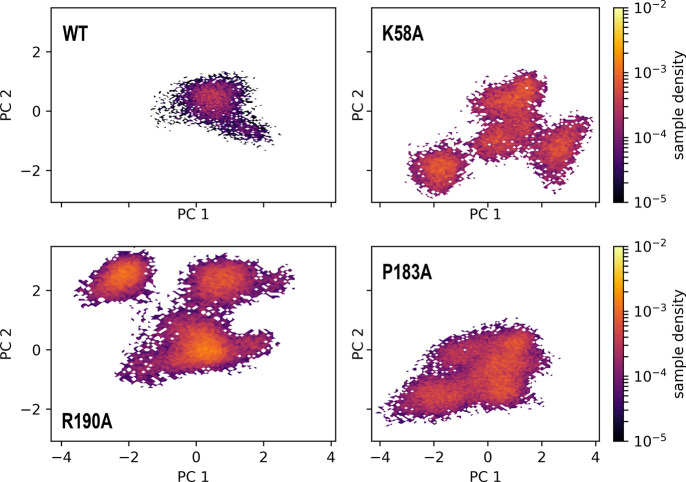
Figure 7.
Active site conformational dynamics of the RdRp without substrate in the active site for WT, K58A, R190A, and P183A. Cα distances between active site residues described in the main text have been projected onto the first two principal components (PC1 and PC2). The sample density describes the fraction of simulation time spent in a particular state in PC-space.

