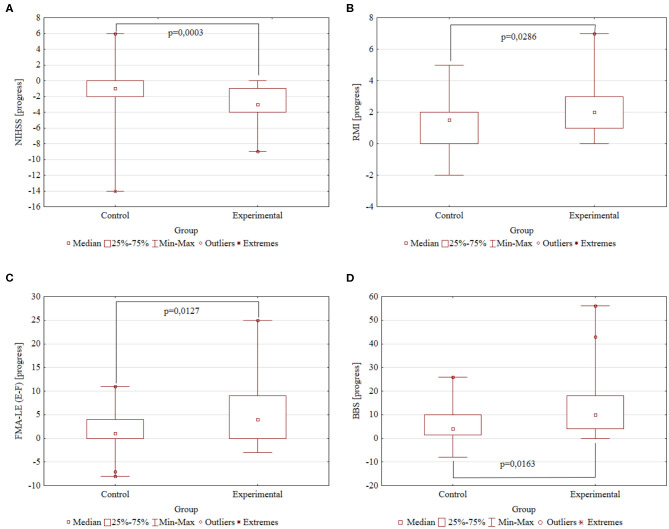
Figure 2.
The rehabilitation progresses. Comparison of the Control (N = 27) and Experimental (N = 35) groups by the study scales. The difference in scores after and before rehabilitation. P-value obtained by two-tailed Mann–Whitney U test. (A) NIHSS progress. (B) RMI progress. (C) FMA-LE progress. (D) BBS progress.

