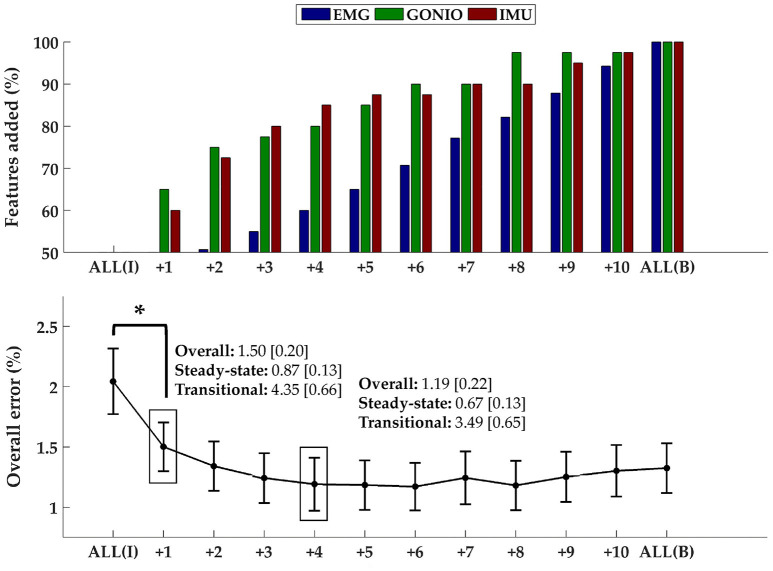
Figure 9.
Sequential addition of contralateral sensors reduces error rates. (Top) The composition of the feature set was expressed as the average cumulative proportion of the total features from each modality after each iteration (displayed from left to right, most to least beneficial). (Bottom) The overall error rate (mean ± SEM) after each iteration. The steady-state and transitional error rates are shown after the addition of one and four contralateral sensor(s). Asterisk denotes a statistically significant difference (p = 1.27 × 10⁻⁴). Data were averaged across 10 subjects.

