. 2018 Oct 4;5:112. doi: 10.3389/frobt.2018.00112
Copyright © 2018 Steed, Pan, Watson and Slater.
This is an open-access article distributed under the terms of the Creative Commons Attribution License (CC BY). The use, distribution or reproduction in other forums is permitted, provided the original author(s) and the copyright owner(s) are credited and that the original publication in this journal is cited, in accordance with accepted academic practice. No use, distribution or reproduction is permitted which does not comply with these terms.
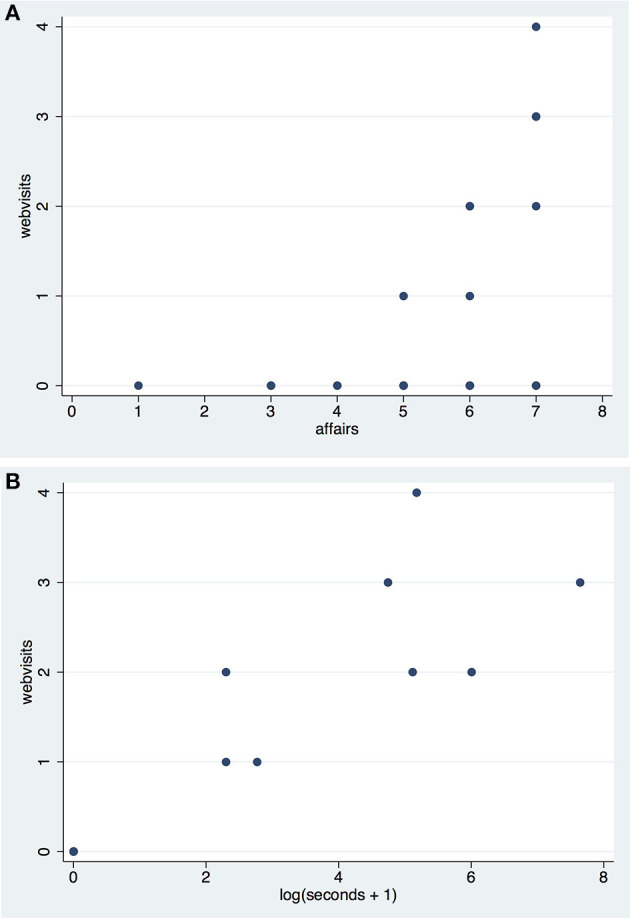
Figure 5.

Scatter diagram of the number of webvisits (A) by affairs (B) log(seconds+1).
