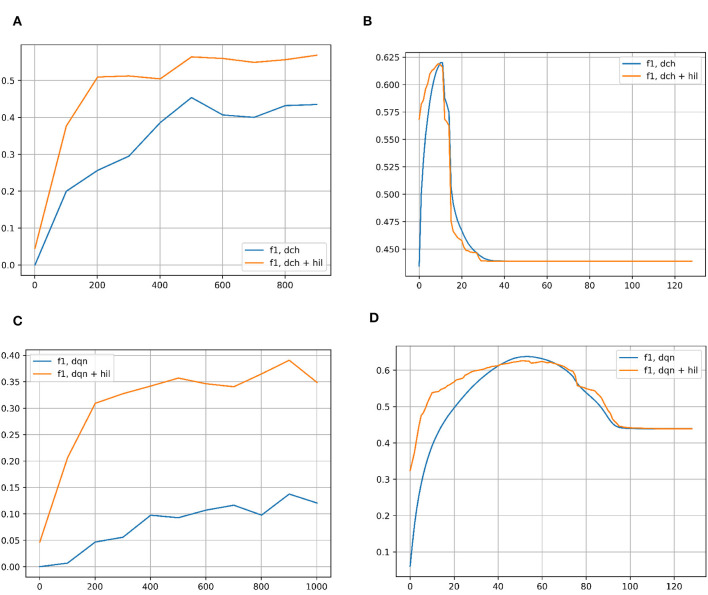
Figure 7.
(A) F1 score for classification on the NUSWIDE-81 dataset with DCH with and without the HIL, as a function of the number of iterations of training of the DCH network. (B) F1 score for classification on the NUSWIDE-81 dataset with DCH with and without the HIL, as a function of the Hamming Distance for classification. The networks are fully trained to the end point shown in subplot (A). (C) F1 score for classification on the NUSWIDE-81 dataset with DQN with and without the HIL, as a function of the number of iterations of training of the DQN network. (D) F1 score for classification on the NUSWIDE-81 dataset with DQN with and without the HIL, as a function of the Hamming Distance for classification. The networks are fully trained to the end point shown in subplot (C). Baseline networks are shown in blue, while the same network with a HIL appended to the end is shown in yellow. Note that in the left column of subplots, the Hamming Distance for classification is set to 2 for inlier/outlier count. Results for DTQ are omitted for incompatibility with NUWSIDE-81. We largely get the same results in the left column as with CIFAR-10, showing an improvement in performance versus training iterations when an HIL is appended to the end of the baseline network, which adds negligible memory/computation costs. In the right column of results, the HIL differs from CIFAR-10's results in that there is a peak to the performance of the HIL enhanced network. This is likely due to NUSWIDE-81 being designed for the task of web image annotation and retrieval.

