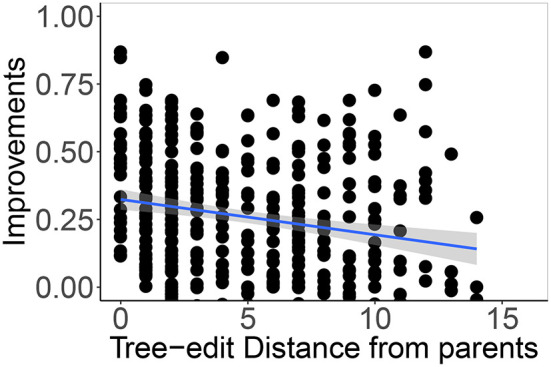
Figure 12.

Correlation of normalized tree-edit distances between a parent and its offspring and improvements in performance the offspring shows. The data points are individual performance differences over nine generations (the second up to tenth) in five generated lineages, aggregated. For correlation we use 90% confidence level interval for predictions from the linear model.
