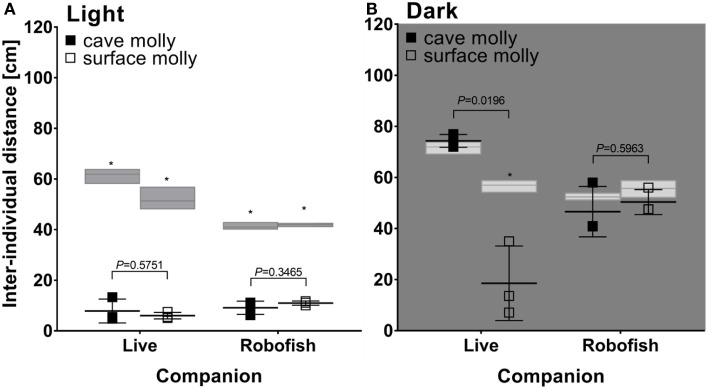
Figure 4.
Social behavior of surface and cave-dwelling mollies tested with live conspecifics and RoboFish in light (A) and darkness (B). Shown are median interindividual distances along with the results of U-tests (P values above bars) comparing cave- and surface-dwelling mollies in each treatment. Gray bars represent median and range of simulated interindividual distances for each treatment, and asterisks indicate a significant difference between simulated and real data in Wilcoxon’s rank tests (P < 0.05).

