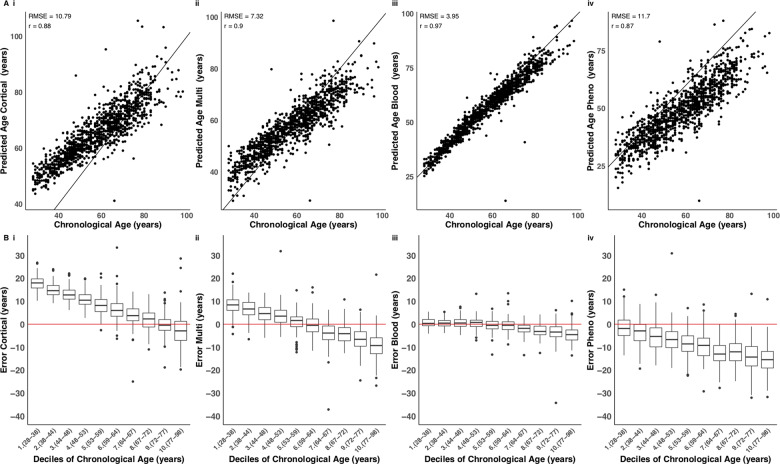
Figure 3.
The blood-based DNA methylation clock performs best in data derived from whole blood samples.(A) Shown is a comparison of DNA methylation age estimates against chronological age in a large whole blood dataset (n = 1175), where DNAm age derived using four DNA methylation age clocks: (i) our novel DNAmClockCortical; (ii) Horvath’s DNAmClockMulti; (iii) Zhang’s DNAmClockBlood and (iv) Levine’s DNAmClockPheno. The x-axis represents chronological age (years), the y-axis represents predicted age (years). Each point on the plot represents an individual in the whole blood dataset. Our novel clock does not predict as well in blood compared to the cortex, although it has a similar predictive ability to Horvath’s clock. The distribution of the error (DNA methylation age − chronological age) is presented in B for each decile for each of the four DNA methylation clocks. Deciles were calculated by assigning chronological age into 10 bins and are represented along the x-axis by the numbers 1 to 10, followed by parentheses, which display the age range included in each decile. The ends of the boxes are the upper and lower quartiles of the errors, the horizontal line inside the box represents the median deviation and the two lines outside the boxes extend to the highest and lowest observations. Outliers are represented by points beyond these lines. The red horizontal line represents perfect prediction (zero error).

