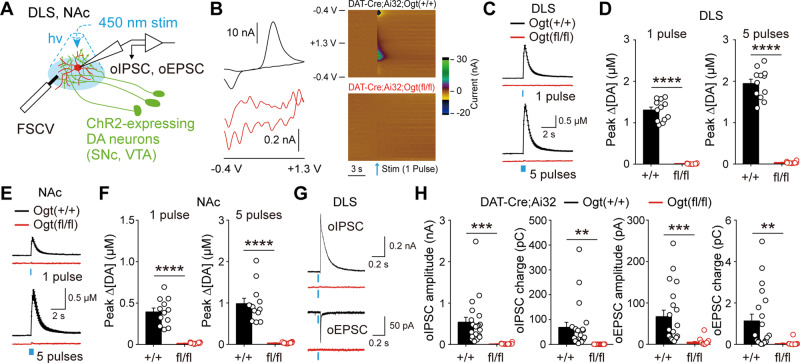
Figure 2.
Downregulation of O-GlcNAcylation in dopamine neurons causes functional impairments at dopamine synapses. (A) Schematic illustration depicting electrophysiological recording of synaptic transmission at dopamine synapses. (B) 2D and colour-coded voltammograms showing oxidation and reduction peaks of dopamine release. (C and D) Summary statistics of dopamine release evoked by one pulse or five pulse stimulation in DLS. (E and F) Summary statistics of dopamine release evoked by one pulse or five pulse stimulation in NAc. (G) Representative recording traces for GABA and glutamate co-transmission at dopamine synapses. (H) Quantification of neurotransmitter co-transmission at dopamine synapses. Blue bar indicates optogenetic light stimulation. Data were analysed by unpaired t-test (D, F and H). Data are represented as mean ± SEM. **P < 0.01, ***P < 0.001, ****P < 0.0001.

