Figure 4.
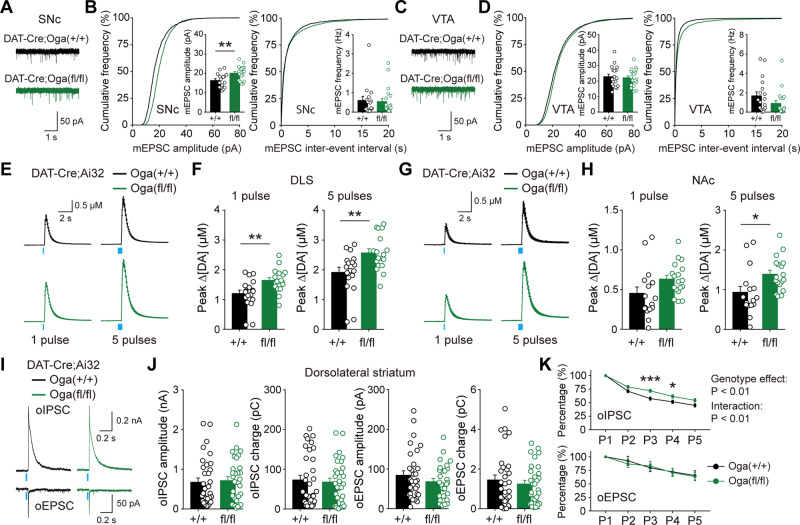
Elevated O-GlcNAcylation facilitates synaptic transmission at dopamine synapses. (A) Representative mEPSC recording traces in SNc. (B) Cumulative graph and summary statistics for mEPSC in SNc. (C) Representative mEPSC recording traces in VTA. (D) Cumulative graph and summary statistics for mEPSC in VTA. (E and F) Summary statistics of dopamine release evoked by one pulse or five pulse stimulation in DLS from DAT-Cre;Ai32;Oga+/+ and DAT-Cre;Ai32;Ogafl/fl mice. (G and H) Summary statistics of dopamine release evoked by one pulse or five pulse stimulation in NAc. (I) Representative recording traces [optogenetically induced excitatory postsynaptic current (oEPSC) and inhibitory postsynaptic current (oIPSC)] made from spiny projection neurons (SPNs) in DLS. (J) Quantification of neurotransmitter co-transmission in DLS. (K) Attenuation of oIPSC and oEPSC by repetitive stimulations. Blue bar indicates optogenetic light stimulation. Data were analysed by unpaired t-test (B, D, F, H and J) and repeated measures two-way ANOVA followed by Sidak’s post hoc test (K). Data are represented as mean ± SEM. *P < 0.05, **P < 0.01, ***P < 0.001.

