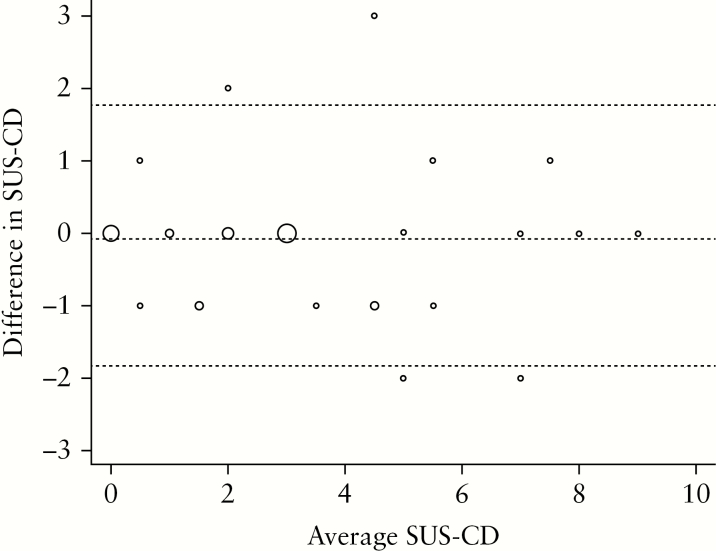
Figure 2.
Bland–Altman plot displaying the agreement between the investigators [F.S. and K.N.] for the calculated activity index on 40 subjects. The size of the circles is proportional to the number of observations at the specific locations. The width of the agreement interval was within clinical acceptable limits. Interobserver analysis was performed after re-examining the development cohort.

