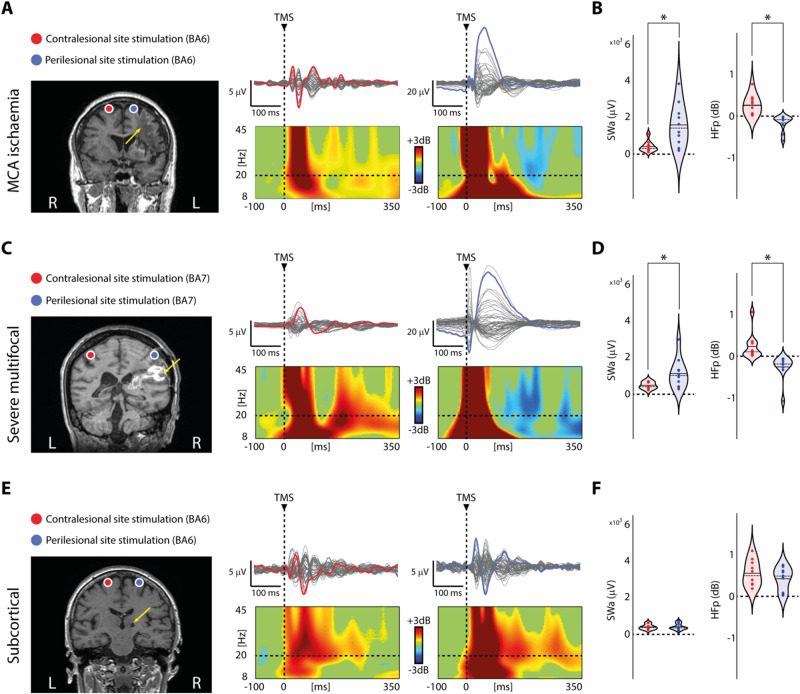
Figure 2.
Perilesional cortical off-periods are present in all patients with cortico-subcortical lesions irrespective of the aetiology. (A, C and E) Results from three representative patients, one for each group (Patients 4, 12 and 23 from Supplementary Table 1, respectively) are shown for both contralesional (red) and perilesional (blue) stimulation sites. For each panel, MRIs and cortical targets as estimated by the NBS system are shown (left). The yellow arrows highlight lesion location. Butterfly plots of the TEPs recorded at all 60 electrodes (traces) are depicted (right). A dashed vertical line marks the occurrence of TMS. ERSP is presented for the EEG electrode (coloured trace) with the largest early response, selected among the four channels closest to TMS. In the ERSP plot, significance for bootstrap statistics is set at α = 0.05 (absence of any significant difference form baseline spectrum is coloured in green). Statistically significant increases of power compared to baseline are coloured in yellow/red, while blue represents significant power decreases. The dashed horizontal line indicates the 20 Hz frequency bin. (B, D and F) Violin plots and individual values of slow wave amplitude (SWa, left) and high-frequency power (HFp, right) calculated for the contralesional (red) and perilesional (blue) stimulation sites for the three groups. Violin plots display the median (dashed line) and the mean (solid line) of the kernel density. *P < 0.05; Wilcoxon signed-rank test.

