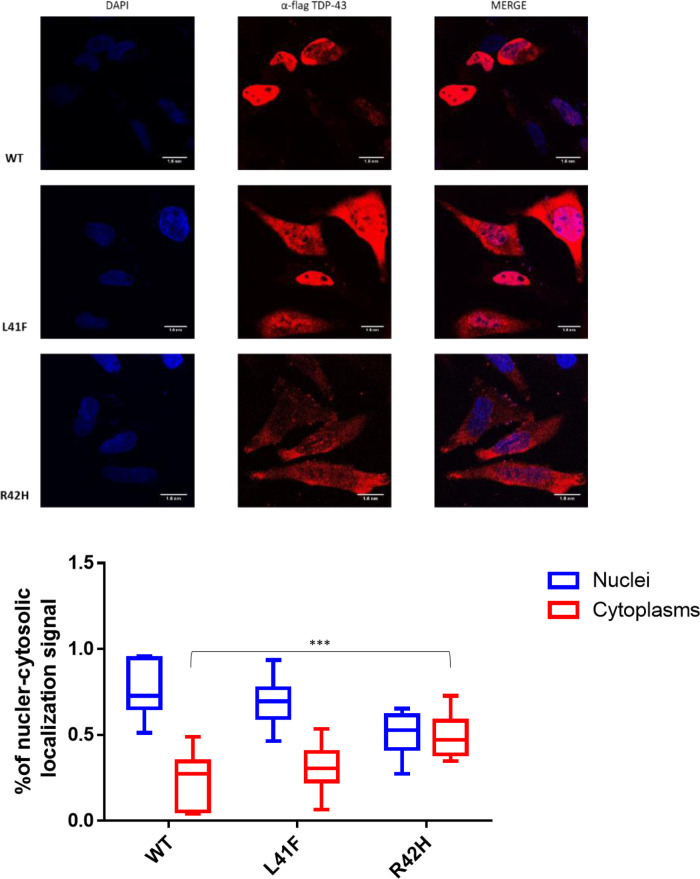
Figure 6.
Impact of TARDBP variants on the localization of flagged-TDP-43 wild-type and mutant proteins overexpressed in HeLa cells. The overexpressed proteins were visualized using anti-Flag polyclonal antibody in a 100 nm/pixel field. Scale bar = 10 nm. Top row: Wild-type Flag TDP-43, followed by Flagged TDP-43s carrying both variants; L41F and R42H. Left column: DAPI staining to indicate the chromatin in the nucleus in blue. Middle column: TDP-43 stained in red with a Flag-specific antibody. Right column: Merged images demonstrating TDP-43 localization in the nucleus for wild-type TDP-43, whilst localizing also in the cytoplasm for both TDP43 with variant R42H and L41F. Bottom: Box plots showing fluorescent TDP-43 signal is quantified in the nucleus and cytoplasm for nine cells of each line. The average ratio of nuclear and cytosolic signal is plotted and compared between groups. ****P < 0.0001 and ***P < 0.001 as calculated by two-way ANOVAs between the groups illustrated.

