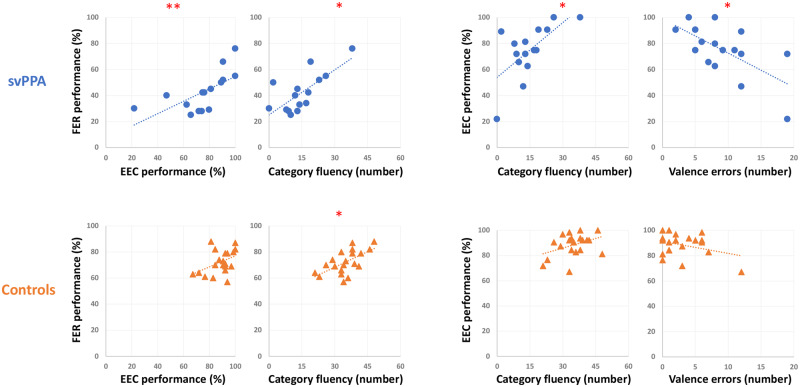
Figure 2.
Correlations plot. Correlations plot for svPPA (top, blue dots) and Control (bottom, orange triangles) groups between FER or valence errors committed during FER and semantic processing, including EEC and category fluency. Asterisks indicate significant correlations at **P < 0.0001 and *P < 0.01.

