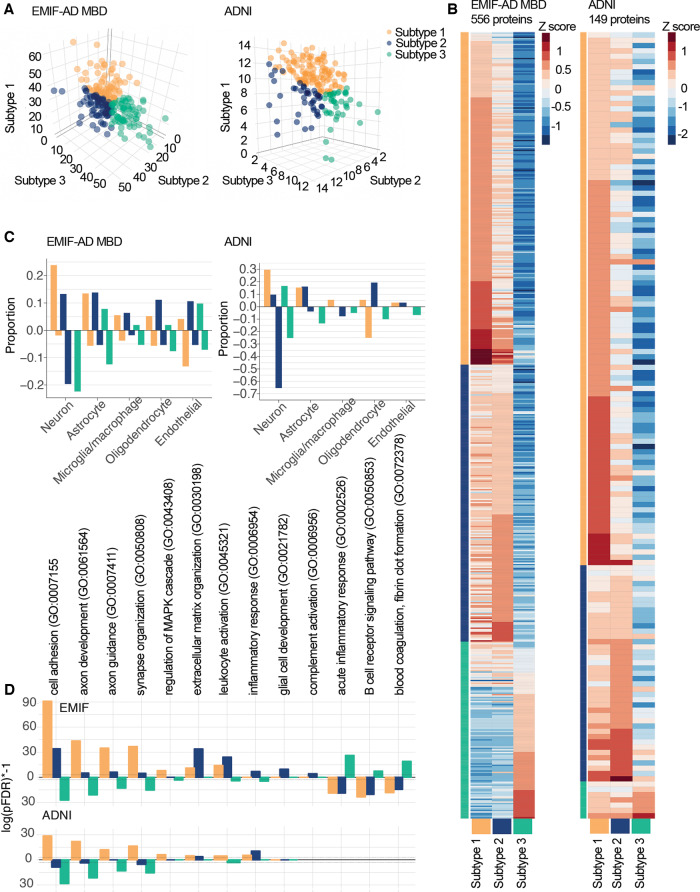
Figure 1.
Cluster results. (A) Subject loadings on subtype scores (orange: subtype 1, hyperplasticity; blue: subtype 2, innate immune activation; green: subtype 3, blood–brain barrier dysfunction) for EMIF-AD MBD (left) and ADNI (right). Each dot shows how an individual matches all three proteomic subtypes at the same time, e.g. the right-most green dot is a subject who shows very high loading on the subtype 3 axis, and very low loadings on subtypes 1 and 2 axes. (B) Heat map of subtype average Z-scores (according to the mean and SD of controls). Labels not shown, see Supplementary Table 5 for list of proteins. (C) Proportion of cell type production for protein levels higher (positive proportions) or lower than control subjects (negative proportions). (D) Selected subset of GO pathways that show subtype-specific enrichment with log(pFDR) positive values for proteins with higher levels than controls, and negative values for proteins with lower levels than controls (see Supplementary Table 7 for complete list of enriched pathways).

