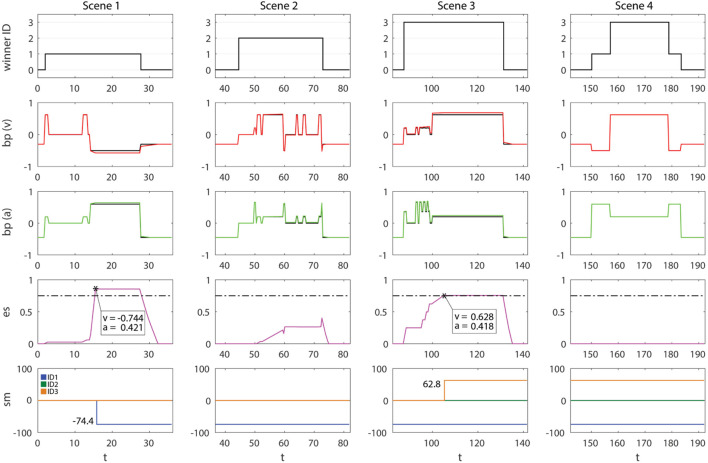
Figure 10.
Results of the HRI experiment with FACE integrating SEAI in condition 3. Columns are the four scenes. Rows are, in order: winner ID, bp (v), bp (a), es, and sm. Effectively executed v′ and a′ are, respectively, colored as red and green lines, while bp values not affected by es are represented as black lines to allow comparison. In es, we pointed out the es (v,a) values that caused the creation of a sm. In sm we reported the values of SMs in the moment in which they have been created by the system. IDs colors are indicated in the sm chart. Time t is expressed in seconds.

