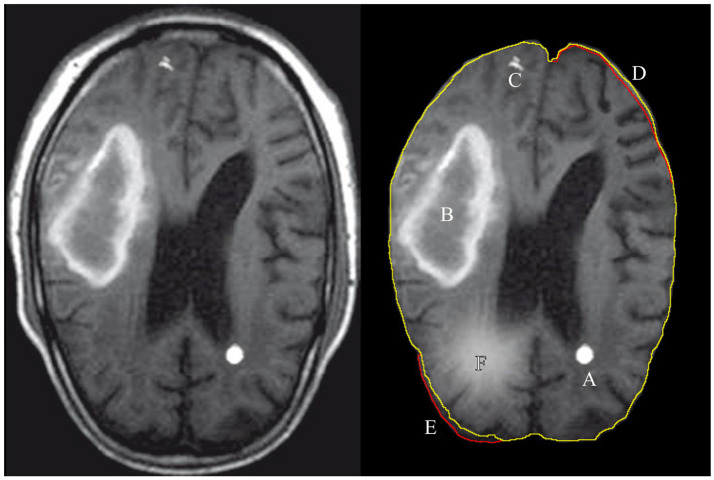
Figure 1.
Illustration of features extracted and used by either a radiologist or a computer algorithm. The left images shows the original MRI image, with the annotated features of interest on the right. A: tumor, B: hematoma, C: calcium deposit, D: the volume decrease in the images brain tissue, E: the volume increase with respect to expected and F: a tissue inflammation. The green contour line associated with features D,E shows the expected (normal) shape of the imaged soft tissue and the red contour shows the actual shape.

