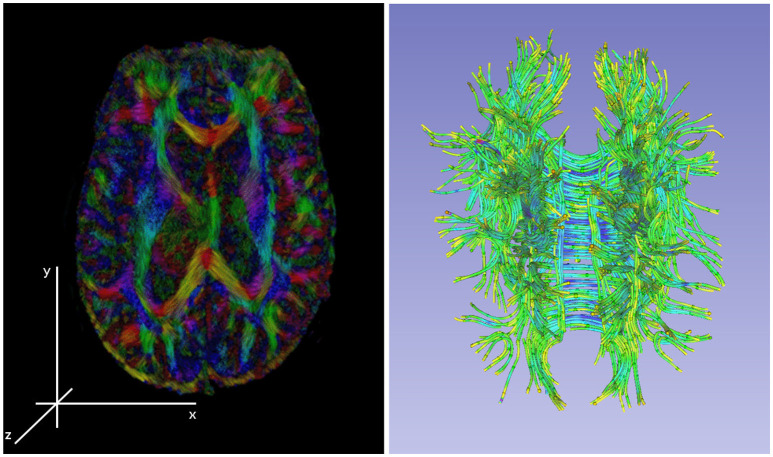
Figure 3.
Left: an illustration of a diffusion tensor imaging 3D reconstruction. Right: the tractology image created by post-processing of the 3D DTI reconstruction from the DWI sources. The tractology image shows 3D view of individual fiber tracts and the color indicating the fluid flow direction within the tract.

