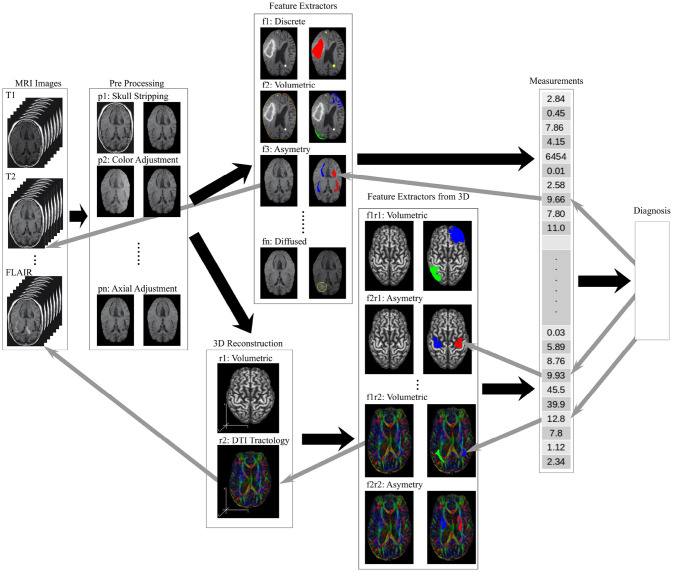
Figure 4.
An illustration of the information flow through a data processing framework needed to analyse brain MRI scans to produce a diagnosis. The raw image sets are first pre-processed (tasks labeled p-), the structural features are extracted (tasks labeled f-), higher order features and measurements calculated from 2D and 3D composites (tasks labeled r- and f-r- respectively), and the final diagnosis model synthesizing the measurement vector of local, regional and global features. The back arrows show the flow of information while the gray arrows show the trace-back feedback needed for a transparent decision support tool used by a radiologist.

