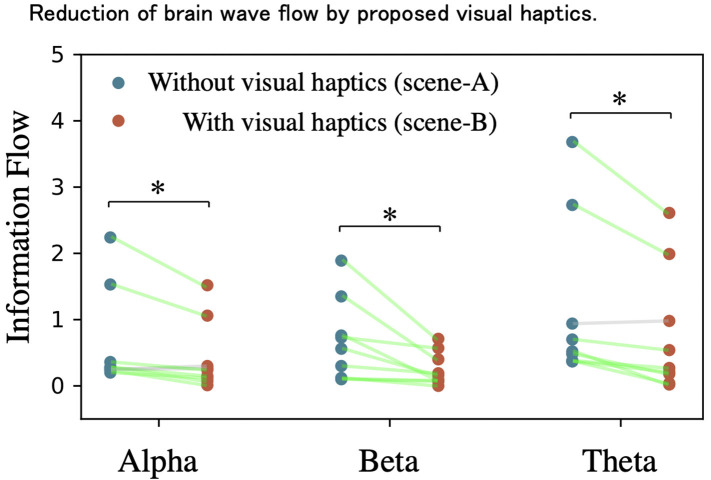
Figure 8.
Reduction of brain wave flow by proposed visual haptics. The vertical axis shows the reduction of the information flow in the brain in in each remaining nine subjects for three frequency bands from the experiments without visual haptics to with visual haptics. Through all of the bands, the reduction ratios were verified for the whole α-wave (t9 = 2.557, p = 0.034 < 0.05, paired t-test), β-wave (t9 = 2.831, p = 0.022 < 0.05, paired t-test), and θ-wave (t9 = 3.181, p = 0.013 < 0.05, paired t-test). *indicates significant difference (p < 0.05) in paired t-test.

