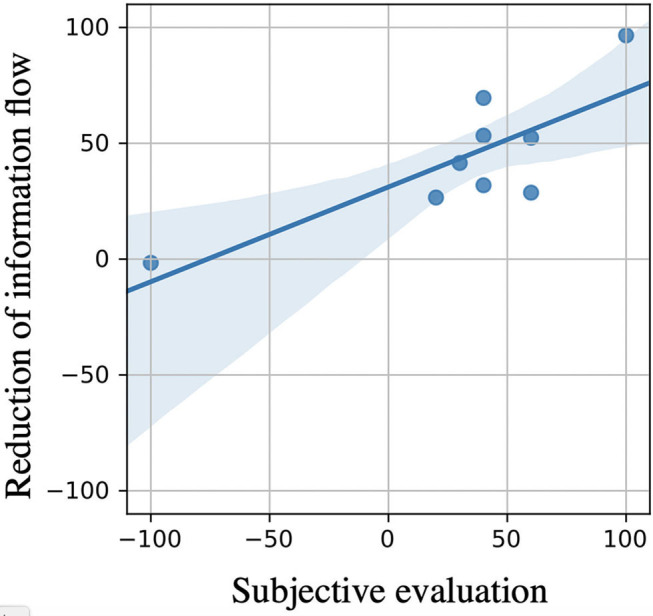
Figure 9.

Relationship between brain wave results and feeling points of subjects. This figure shows the correlation between the reduction of the information flow in the brain by visual haptics image described in the vertical axis and the “subjective evaluation” in the horizontal axis which were answered by each subject in the post questionnaire of the experiment (+100 corresponds to “highly effective,” 0 corresponds to “no effective at all,” and – “100 corresponds to disturbed usability by visual haptics”). Therefore, the “subjective evaluation” is positive if the subject feels the advantage of the visual haptics feedback and negative if the subject feels the disadvantage. This result shows a high correlation, i.e., Pearson correlation factor of 0.795 (p-value: 0.011 < 0.05), between the subjective usability points and the brainwave measurement results. The shaded area is the 90% confidence interval.
