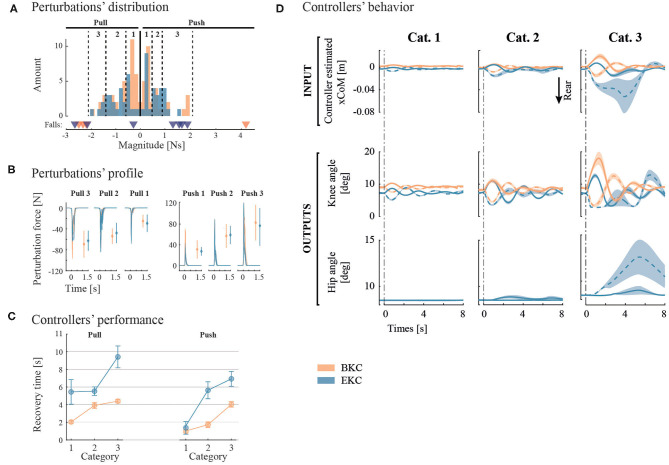
Figure 5.
Pulse perturbation results and controllers' outputs. (A) The perturbations of similar magnitude are grouped in 3 categories for each direction. The thresholds of each category are represented by the vertical dotted lines. Underneath the histograms, perturbations that led to a fall are presented by a triangle. (B) Individual perturbation force profiles are shown by category. In addition, the average and standard deviation of the maximum perturbation forces are shown with error bars. (C) Controllers' performance is evaluated with the recovery time. (D) average system response of the two controllers subject to the 3 categories of perturbation Magnitudes. Solid lines represent posterior perturbations, while dotted lines denote anterior ones. Overall, the colors correspond to the controllers (orange for BKC and blue for EKC).

