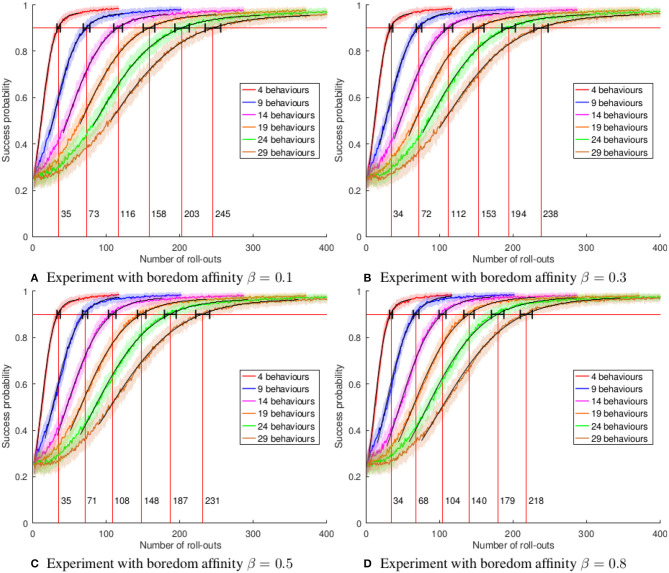
Figure 8.
Evolution of the simulated success rates over the number of rollouts for different numbers of preparatory behaviors with different values for the boredom affinity β parameter. For each curve from left to right, five behaviors are added. The red horizontal lines denote an average success rate of 90%. The selected parameter values were β ∈ {0.1, 0.3, 0.5, 0.8, 1.0}. The graph for β = 1.0 is shown in Figure 7B. Increase of affinity yields a significant increase of the learning speed proportional to β. (A) Experiment with boredom affinity β = 0.1. (B) Experiment with boredom affinity β = 0.3. (C) Experiment with boredom affinity β = 0.5. (D) Experiment with boredom affinity β = 0.8.

