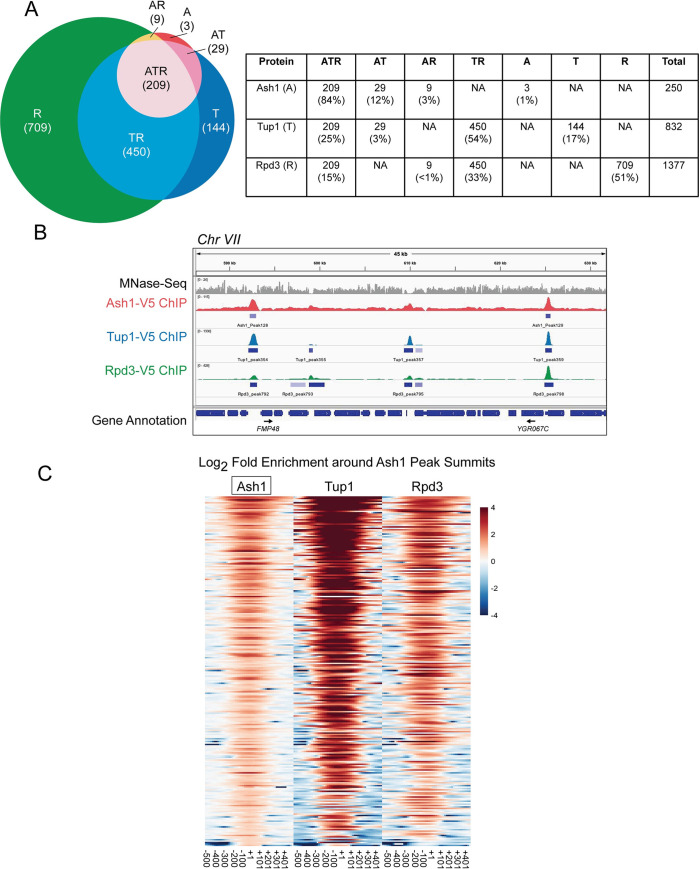
Fig 4. Most Ash1 genomic sites are co-occupied by Tup1 and Rpd3.
(A) Sites of overlap between Ash1-V5, Tup1-V5, and Rpd3-V5 ChIP-Seq peaks were determined. The table displays the number of peaks and percentage of peaks in each category of single factor peaks and overlapping factor peaks, where A = Ash1, T = Tup1 and R = Rpd3. Overlap is shown visually in the Venn diagram at the left. (B) Snapshot of ChIP-Seq results from the Genome Browser IGV (Broad Institute), showing the sequenced fragment pileups for a portion of chromosome VII, with each factor autoscaled independently because each factor had a different ChIP efficiency. The top track (gray) shows MNase-Seq for nucleosome positioning reference [5]. The colored tracks show ChIP-Seq results for Ash1-V5 (red), Tup1-V5 (blue) and Rpd3-V5 (green). The bottom track displays gene annotations. Gene names are indicated only for those with start sites downstream of a site of Ash1-V5, Tup1-V5, and Rpd3-V5 (ATR) co-enrichment. Additional snapshots are shown in S4 Fig. (C) Heat maps depict the log2-fold enrichment of Ash1-V5, Tup1-V5 and Rpd3-V5 at Ash1-V5 peak summits genome-wide (246 peaks), displaying enrichment from -500 to +500 nucleotides relative to the center of each Ash1-V5 peak, in bins of 20-bp. The color scale at the right indicates the level of log2 fold enrichment for each factor. Each horizontal line depicts a single Ash1-V5 peak of enrichment. The number of peaks is less than that reported in Fig 4A because only the strongest peak per intergenic region was used for the analysis.

