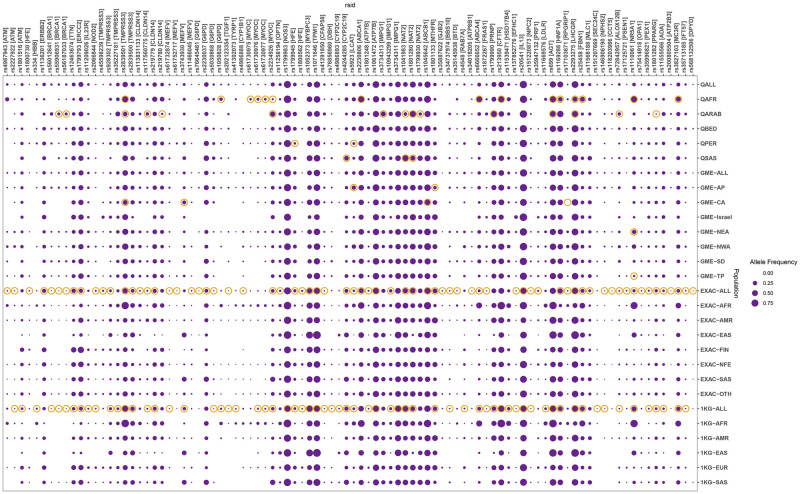
Fig 3. Comparison of allele frequencies.
The figure represents a subset (p-value < 0.01) of all statistically significant variants obtained after applying the Fisher’s Exact Test (S1 Fig). The orange circles highlight variants that were significantly different either within the Qatar or GME subpopulations, or with respect to global population averages ExAC and 1000 Genomes. The populations shown are, in order: Qatari population (QALL) and sub-populations African (AFR), Arab (QARB), Bedouin (QBED), Persian (QPER), and South Asian (QSAS), GME population (GME-ALL), and sub-populations northwest Africa (GME-NWA), northeast Africa (GME-NEA), Arabian peninsula (GME-AP), Israel (GME-Israel), Syrian desert (GME-SD), Turkish peninsula (GME-TP) and Central Asia (GME-CA), ExAC population (EXAC-ALL), sub-populations African/African American (EXAC-AFR), Latino (EXAC-AMR), East Asian (EXAC-EAS), Finnish (EXAC-FIN), Non-Finnish European (EXAC-NFE), South Asian (EXAC-SAS) and Other (EXAC-OTH), 1000 Genomes population(1KG-ALL) and sub-populations African(1KG-AFR), Ad Mixed American(1KG-AMR), East Asian(1KG-EAS), European(1KG-EUR) and South Asian(1KG-SAS).

