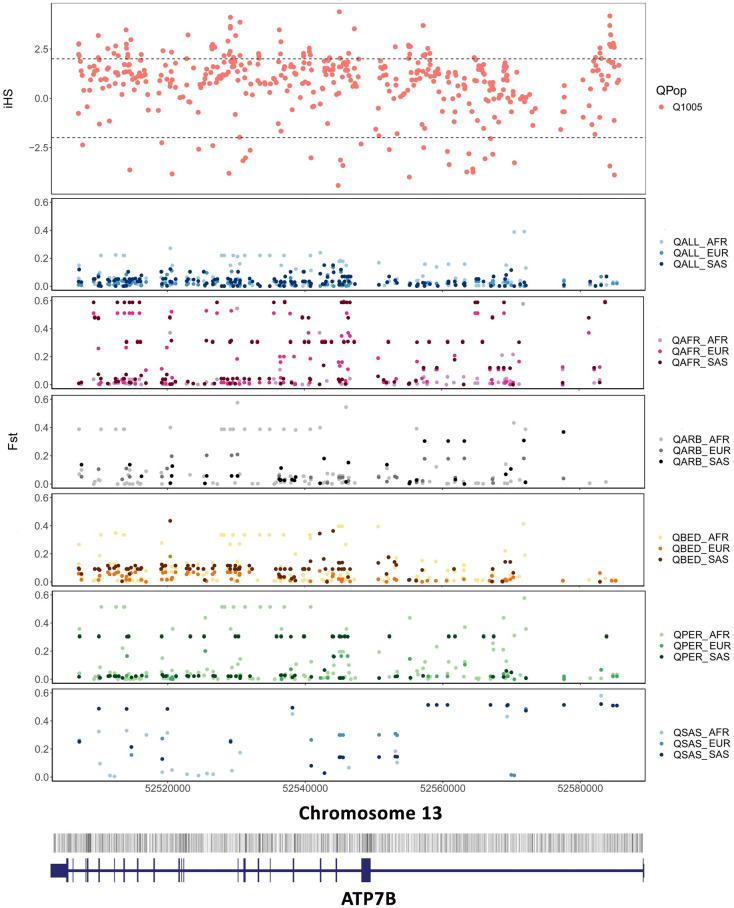
Fig 4. Signatures of positive selection in the ATP7B gene in the Qatar population.
The figure depicts the iHS scores (top) for all known variants of the ATP7B gene plotted along the length of the gene loci shown below. The subsequent boxes depict all the pairwise Fst scores for the Qatar population as a whole (QALL), as well as all its subpopulations (QAFR, QARAB, QBED, QPER, and QSAS). The array of lines at the bottom represents all known variants along the length of the gene, the exon structure of which is shown beneath it.

