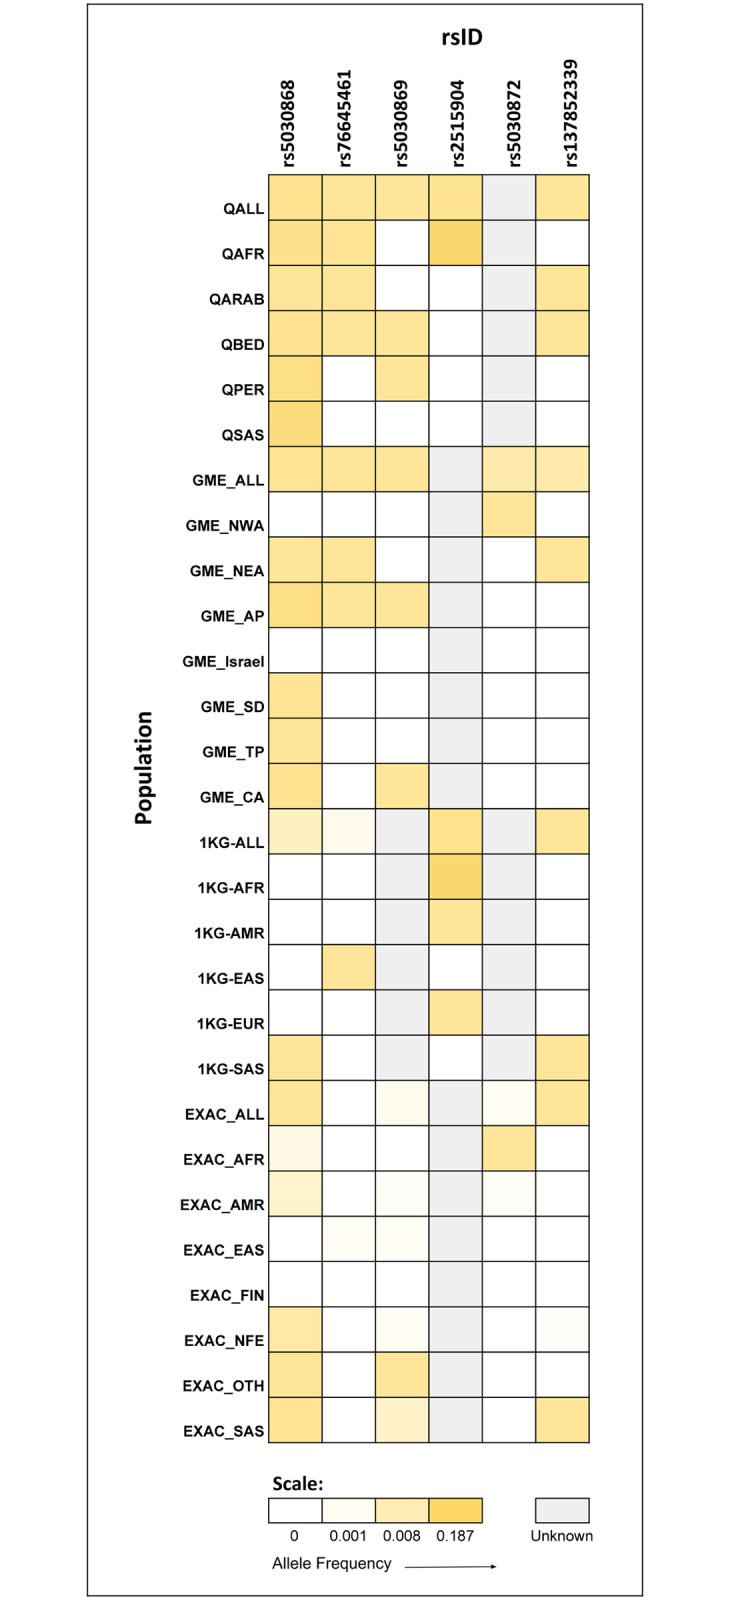
Fig 5. Allele frequency heat map.

The figure depicts the variation in allele frequency distribution of all known G6PD pathogenic/likely pathogenic variants across four major datasets—Qatar, GME, 1000 Genomes and ExAC.

The figure depicts the variation in allele frequency distribution of all known G6PD pathogenic/likely pathogenic variants across four major datasets—Qatar, GME, 1000 Genomes and ExAC.