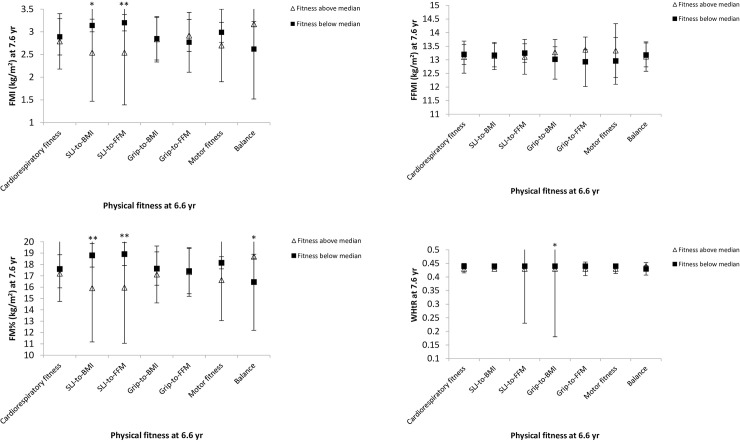
Fig 1. Association of physical fitness below or above the median at 6.6 yr with body composition at 7.6 yr.
Analysis of covariance (ANCOVA) was applied adjusting for maternal BMI, maternal educational attainment, child’s age and sex at baseline and follow-up measurements. Data are represented as estimated marginal means with their 95% confidence intervals. BMI—body mass index; FFMI—fat-free mass index; FM—fat mass; FMI—fat mass index; WHtR–waist-to-height ratio. Differences between the two groups: *p < 0.05, **p < 0.01.

