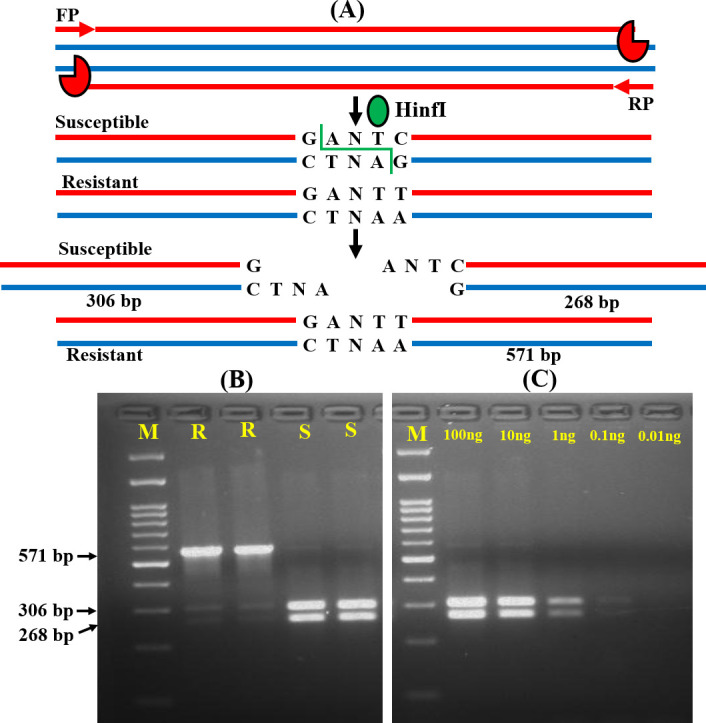
Fig 3. RSM analysis for ERG11 mutation screening.

(A) Schematic representation of RSM assay for the C461T mutation screening among resistant (R) and susceptible (S) isolates. (B) Agarose gel image of the fragments specific for R and S isolates (C) Gel image of gradually diluted DNA samples to confirm the analytical sensitivity of the RSM assay. M: 100 bp molecular weight markers.
